Apple warning triggers latest wobble
Another wobble in financial markets has raised anxiety among investors once again as an Apple revenue warning, followed by a flash crash in various currency pairs in illiquid trade increases concerns.
Apple’s warning, specifically around the speed of the deceleration in China and the impact of a trade war, has fed into people’s already bleak outlook for this year. Coming at a time when anxiety is already heightened has clearly exacerbated the move also, with traders seemingly jumping at any excuse to take risk off the table, which has naturally been beneficial for safe havens.
This was clearly the situation with the yen, although in this case there was obviously other factors at play given the speed and magnitude of the move. The yen is widely considered a safe haven currency, hence the appeal, and continues to trade significantly higher across the board, although much of the initial rally has since been reversed.
USDJPY Daily Chart
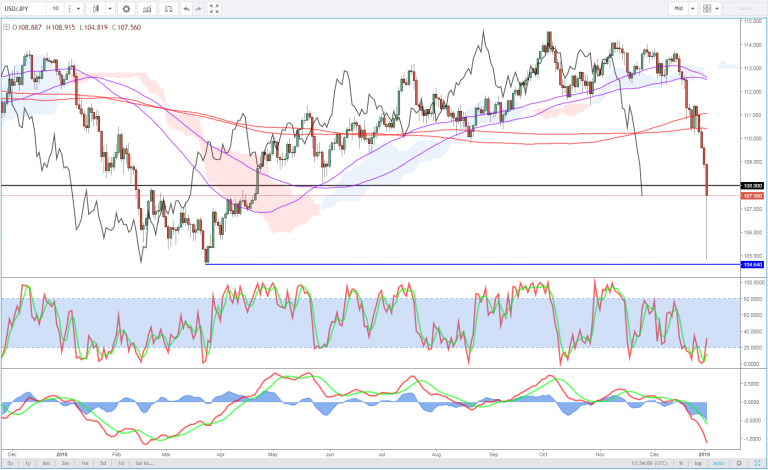
The yen has been performing well for much of the last month as US markets suffered their worst December since 1931 although the gains over the last 24 hours are extreme.
Safe haven gold continues climb to $1,300
Gold once again looks to have benefited from the market instability, with the traditional safe haven quickly closing in on $1,300 after rallying around 8% from its mid-November lows. The dollar has had a better start to the year but the recent trend is very much against it which is likely to be supportive for gold in the near-term.
Gold Daily Chart

Momentum very much remains with the yellow metal, although that may wane the closer we get to $1,300, at which point the $1,280 becomes a notable area of potential support.
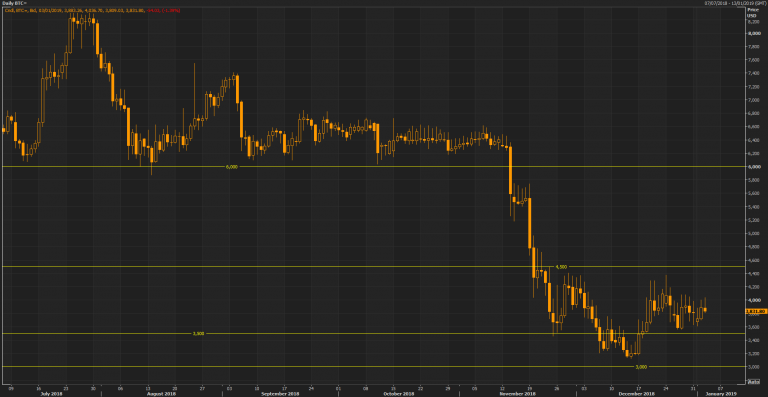
Bullish case for bitcoin?
Cryptocurrency enthusiasts may have been encouraged by how the market has stabilized over the last month, with the month previous being quite devastating for the space as bitcoin finally broke below $6,000 before quickly falling around 50%. Since then, bitcoin has failed to make a new low and has peaked close to $4,500 – a near 50% gain. Just another month in cryptoland.
More encouraging – at least in the near-term – has been the fact that the late December drop saw bitcoin bottom around $3,500, a similar level to where it found support late November. What this means, from a technical standpoint, is that a break of $4,500 would now complete an inverse head and shoulders, potentially laying the groundwork for a nice rally.
A completion of this pattern gives a conservative possible price projection of around $5,500 – based roughly on the size of the shoulder to the neckline (≈$4,500-$3,500) – and a full possible projection of around $6,000 – based roughly on the size of the head to the neckline (≈$4,500-$3,000). This coincidentally coincides with the previously mentioned long-term support making it a very interesting level of potential resistance.
Bitcoin Daily Chart