The price of crude oil rose slightly in the Asian session after an encouraging report from the American Petroleum Institute (API). The report showed that inventories declined by more than 4.8 million barrels in the previous week. This is a sign that demand is slowly creeping back. Just last week, data from the EIA showed that inventories fell by more than 4 million barrels. The EIA will release its data today and analysts expect the inventories to jump slightly by 1.1 million barrels.
The euro rose slightly in overnight trading as the market reacted to the positive meeting between Angela Merkel and Emmanuel Macron. In the meeting, the two leaders agreed to raise funds to support the poorer eurozone member states like Spain and Italy. The European Commission will raise more than $540 billion by issuing bonds, which will be repaid by the EU’s budget. Germany and France are the biggest contributors to this kitty. The euro will move today after Eurostat releases the April inflation data. Analysts expect the CPI to rise by 0.4% year on year and 0.3% month on month. The core CPI is expected to rise by 0.9% year on year.
The Canadian dollar gained slightly partly due to the improving environment in the oil sector. The currency will react to the CPI data that will be released by Statistics Canada. Analysts expect the headline consumer price index to decline by 0.6% month on month and 0.1% year on year. This decline will mostly be because of low energy prices. By slipping into deflation, the Bank of Canada will be under pressure to lower interest rates and possibly boost its quantitative easing program.
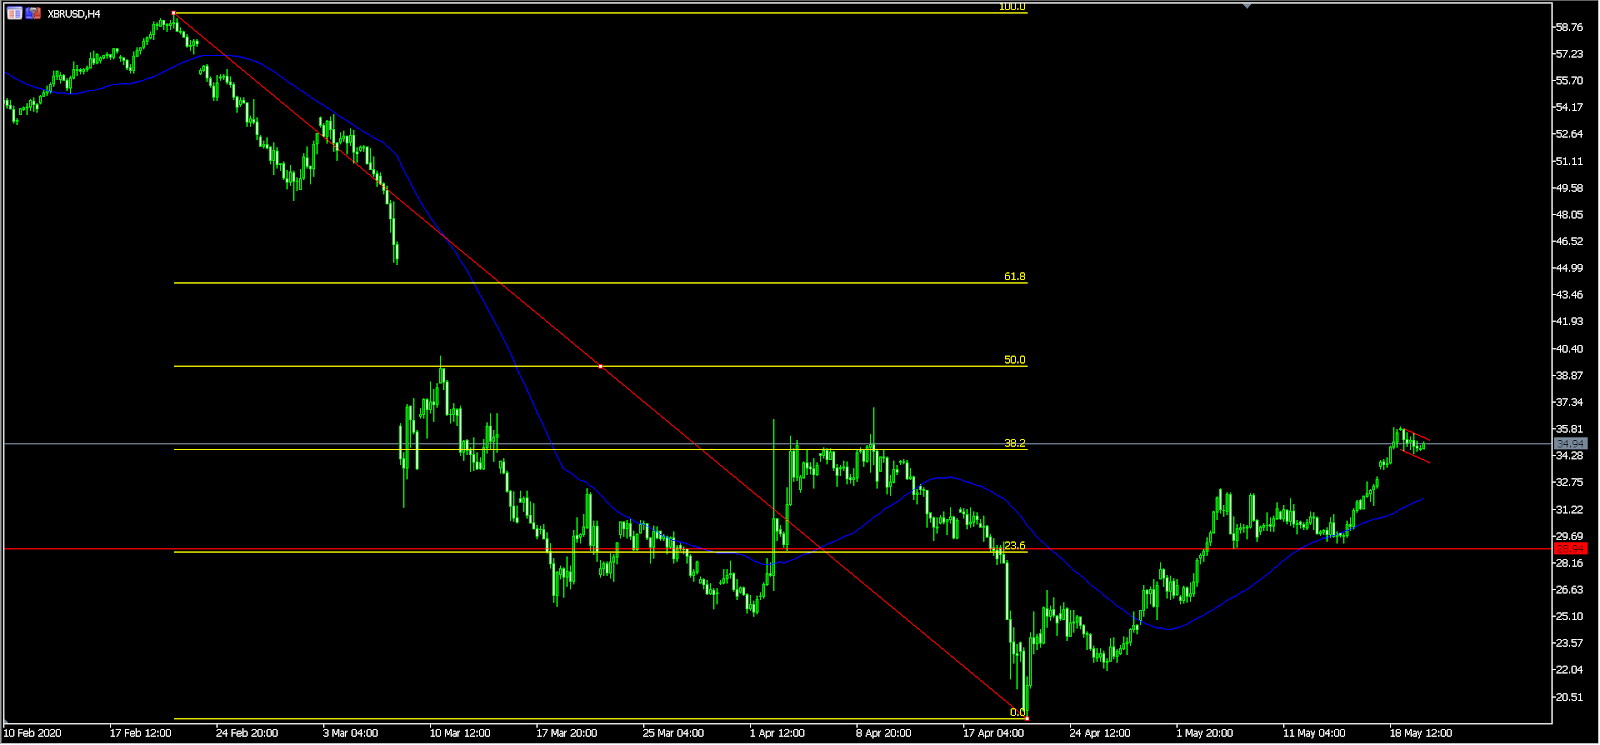
XBR/USD
The XBR/USD pair is trading at 34.92, which is slightly below yesterday’s high of 35.86. On the four-hour chart, this price is along the 38.2% Fibonacci Retracement level. It is also below the 50-day exponential moving average. Interestingly, the pair has formed a bullish flag pattern that is shown in pink. This is an indication that the price will breakout in the upside as bulls remain in control.
EUR/USD
The EUR/USD pair rose to an intraday high of 1.0944 in overnight trading. On the hourly chart, the price is above the 61.8% Fibonacci retracement level and above the short and medium-term moving average. The pair has formed a bullish pennant pattern, which means that the price may breakout in the upper direction as bulls attempt to test the previous high of 1.0975.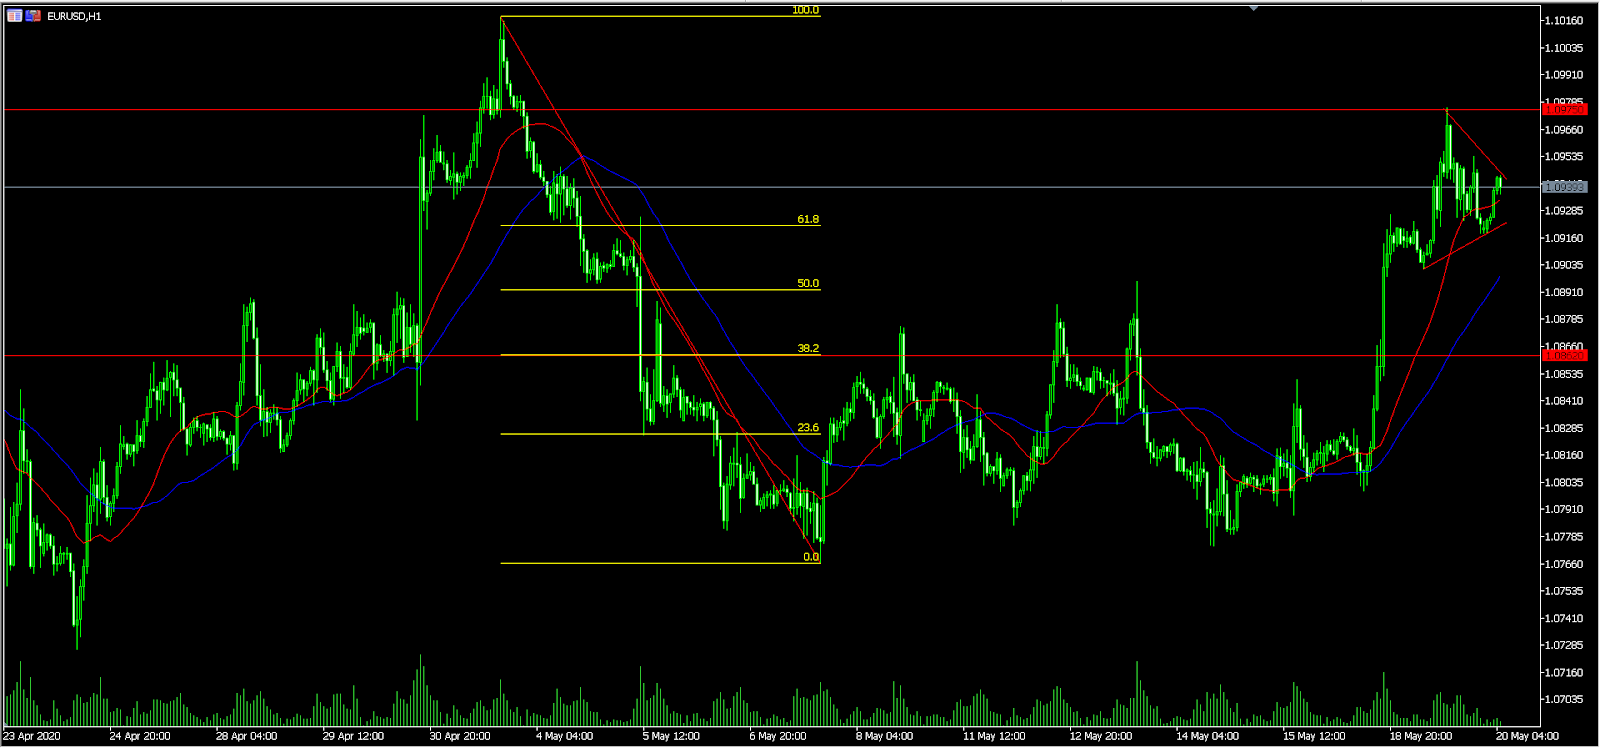
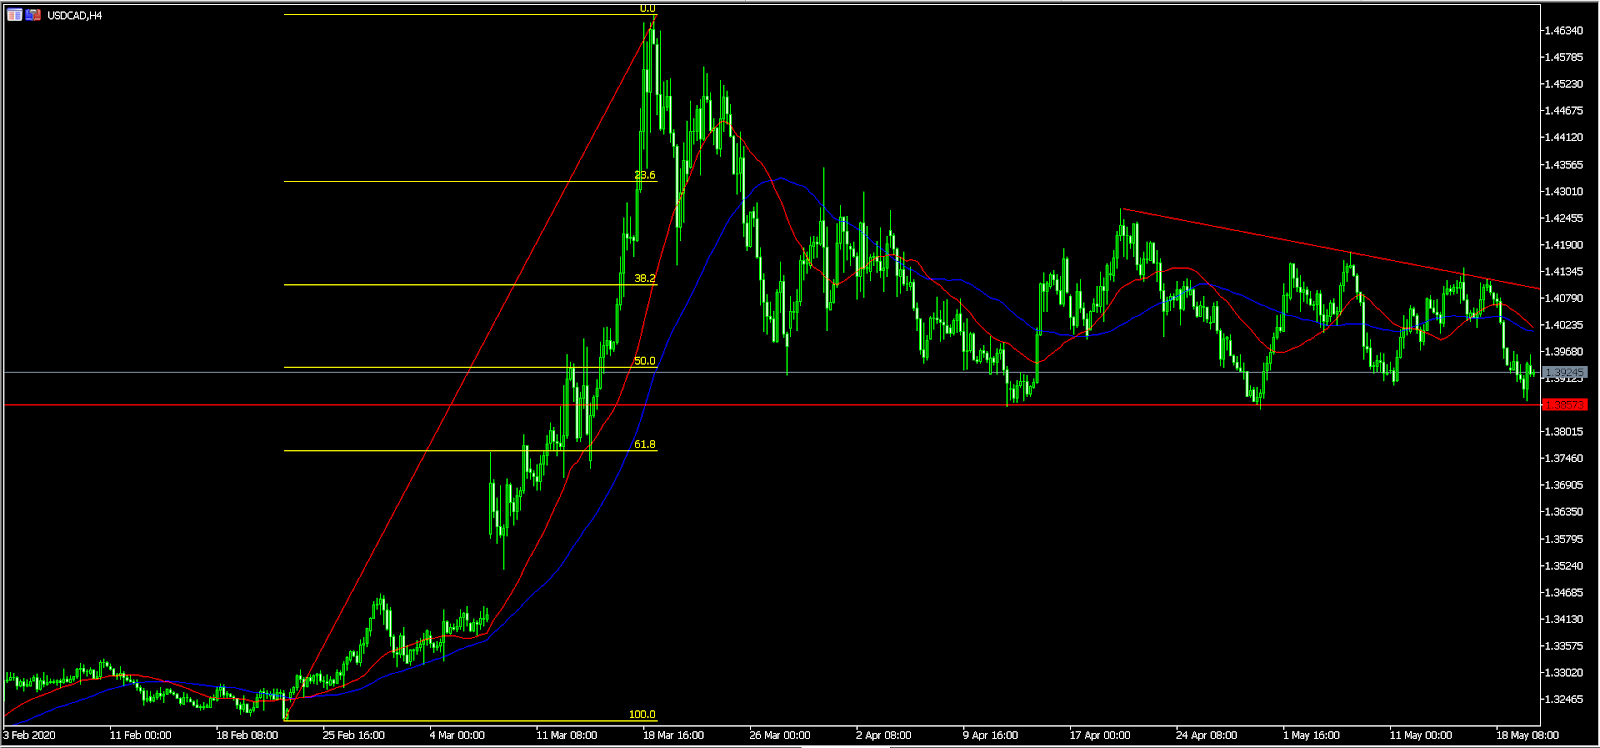
USD/CAD
The USD/CAD pair declined slightly ahead of the FOMC minutes and the Canadian central bank decision. The pair is trading at 1.3923, which is lower than Monday’s high of 1.4137. On the four-hour chart, the price is slightly below the 50-day and 25-day exponential moving average. Also, the price appears to be forming a descending triangle pattern, which means that it will possibly break out in the lower side.