The Australian dollar declined slightly as investors reacted to the Chinese inflation data. According to the statistics office, the headline consumer price index rose by 2.7% in July, pushed up by a 13% increase in food prices. Analysts polled by Reuters were expecting the CPI to rise by 2.6%. The important pork prices rose by 86% while vegetables rose by 8%. Meanwhile, the producer price index declined by 2.4%, which was better than the previous decline of 3.0%.
The US dollar index declined slightly as traders reacted to faltering stimulus talks in the US. On Friday, Donald Trump signed an executive order, extending some of the payments to Americans. That was after talks between Democrats and Republicans failed to reach an agreement last week. Still, some members of both parties have said that the orders are unconstitutional. In the previous negotiations, Democrats want the president to support their $3.6 trillion stimulus package that includes the boosted $600 unemployment cheque. Republicans, on the other hand, have proposed a $1 trillion package that slashes the cheque to $200.
The economic calendar will be relatively muted today. The only major data will come from the US, where the Bureau of Labour Statistics will release the July job openings data. The data will come two days after the bureau released impressive employment numbers from the US. The nonfarm payrolls numbers showed that the economy added nearly 1.8 million as the unemployment rate fell to 10.2%. The number was higher than the 1.5 million that economists were expecting. Another important number will be the British Retail Consortium (BRC) retail sales monitor data.
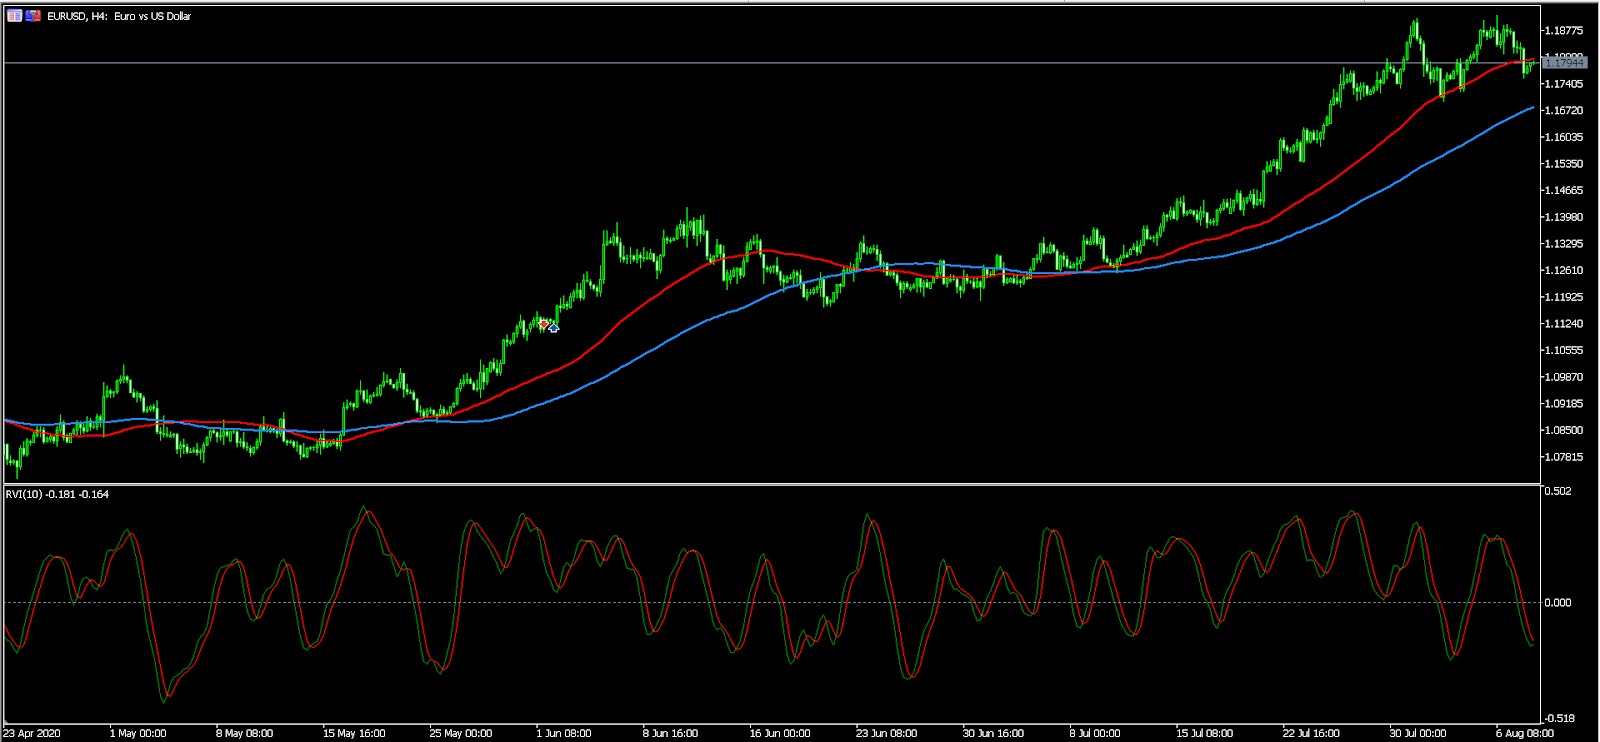
EUR/USD
The EUR/USD pair declined slightly to an intraday low of 1.1755. On the four-hour chart, the price is slightly below the 50-day EMA and slightly above the 100-day EMA. The two lines of the Relative Vigour Index (RVI) have moved below the neutral line. Also, the price is in the neckline of the head and shoulders pattern. This means that the price is likely to remain in a holding pattern today and possibly break out below 1.1700 in the near term.
XBR/USD
The XBR/USD pair is trading at 44.96, which is slightly below the 45 that it reached last week. The daily chart shows that the pair has been in a holding pattern above 40 for the past few weeks. The pair is along the 50% Fibonacci retracement level. Also, it is slightly above the 50-day and 100-day EMA while the Average True Range (ATR) has fallen to the lowest level since January this year. Importantly, the pair has formed a rising wedge pattern, which means that the price may ultimately break out lower.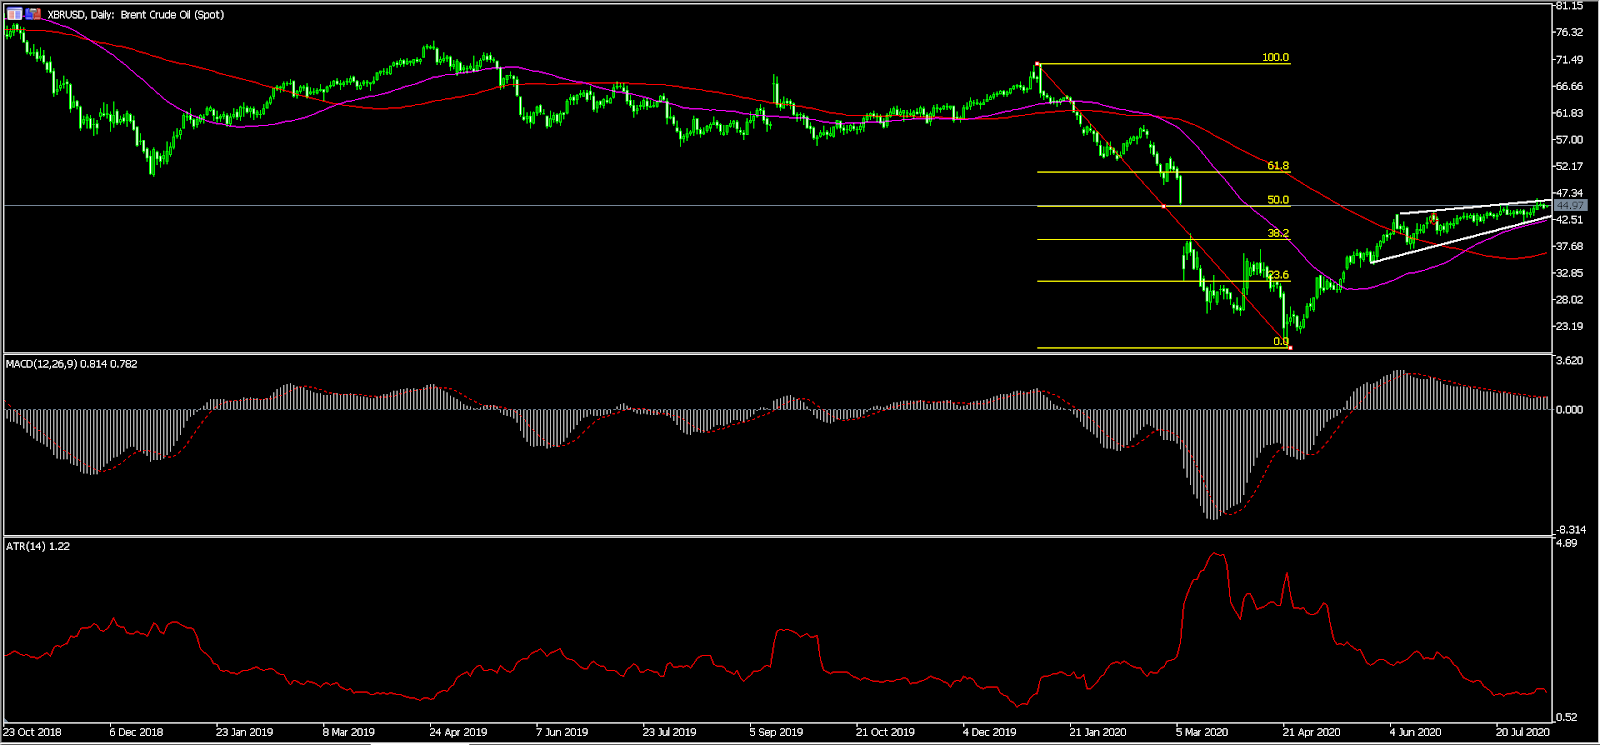
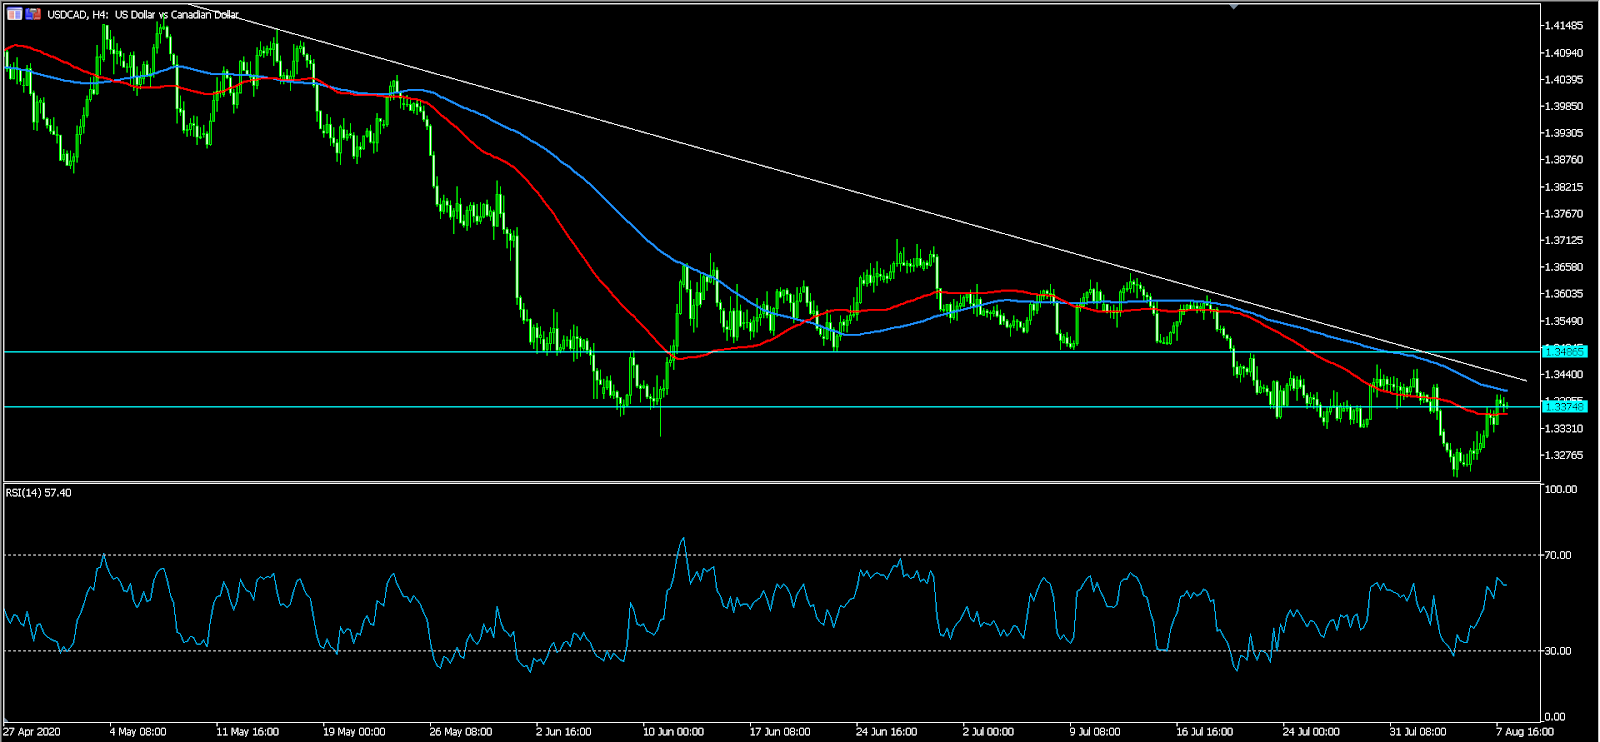
USD/CAD
The USD/CAD pair is little changed at around 1.3375. On the four-hour chart, the price is slightly above the 50-day EMA and slightly below the 100-day EMA. It is also slightly below the descending trend line that is shown in white below. Also, the RSI has climbed to the current high of 57. Therefore, the pair will remain in a downward trend so long as the price is below this descending trend line.