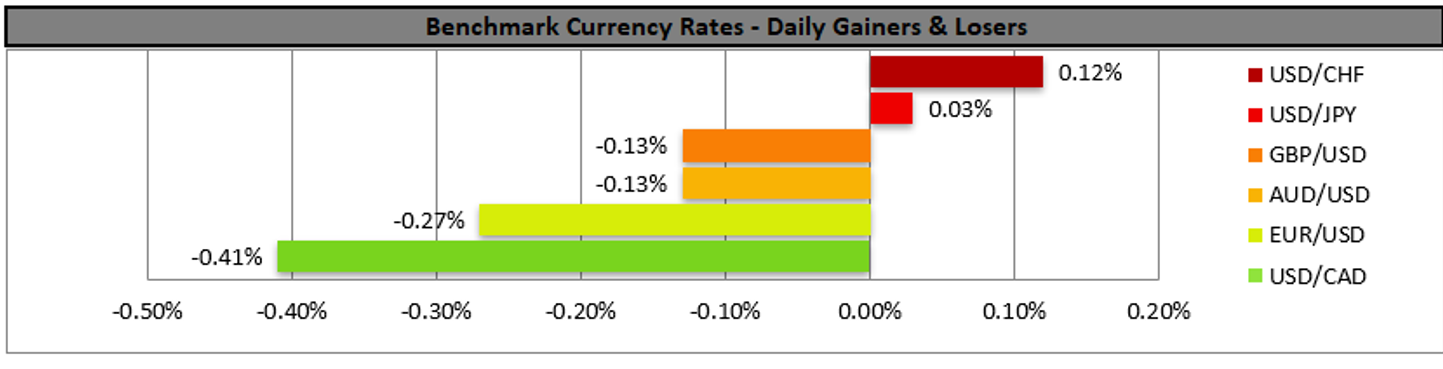
The USD continued to rise against a number of its counterparts yesterday while also US stock markets were in the greens for a second consecutive day, as market worries for the reddit aligned retail traders tended to cool off. Overall, the US economy seems to be in a better position to recover, at least compared to the European one and that tends to feed the USD bulls. The view was enhanced also by latest developments in Washington, which seem to show that the US government is about to expedite more stimulus spending. It should be noted that the rise of the USD is accompanied by a simultaneous rise for the US stock markets, despite their traditional adverse relationship, which may be an additional sign of increased market optimism.
Should the market sentiment continue to be on the bright side, we may see the USD gaining further, while traders may also keep an eye out for financial releases and the plethora of Fed officials which are scheduled to speak in the late American and early Asian session. THE USD Index continued to rise yesterday testing the 91.07 (R1) resistance line. We maintain a bullish outlook for the index as long as it remains above the upward trend line incepted since the 27th of January. Please note that currently the convergence of the 100 moving average towards the 200 moving average and at the same time the fact that the RSI reading remains above the reading of 50, imply that the bulls may have the advantage. Should the bulls actually maintain control, we may see the USD Index breaking clearly the 91.07 (R1) resistance line and aim for the 91.65 (R2) level. Should the bears take over, we may see the index aiming if not breaking the 90.55 (S1) support line.
Oil prices rally production cut possibility
Oil Prices continued to rise yesterday after hitting their highest in almost a year, supported by a positive market sentiment which tends to expect economic activity to rise, an unexpected drawdown in U.S. crude oil inventories and an OPEC+ estimate of a global oil market deficit for the current year. According to Reuters the OPEC+ group expects production cuts to keep the oil deficit in the market throughout the year and even cited a peaking of 2 million barrels in May, despite demand may be less than originally expected. At the same time the unexpected drawdown as reported by API, yesterday tended to also boost oil prices, while oil traders today are expected to keep an eye out for the EIA crude oil inventories figure.
WTI’s prices rallied yesterday clearly breaking the 54.20 (S1) resistance line, now turned to support. We tend to maintain a bullish outlook for black gold’s prices, given also that the RSI indicator below our 4-hour chart seems to be running across the level of 70, underscoring the bull’s dominance, yet at the same time it may also imply that the commodity’s long position is rather overcrowded and a correction lower could be in the cards. Should the buying interest persist, we may see WTI’s prices breaking the 56.00 (R1) resistance line , aiming for higher grounds. Should sellers take the initiative on the other hand, we may see WTI’s prices breaking the 54.20 (S1) support line on their journey southwards.
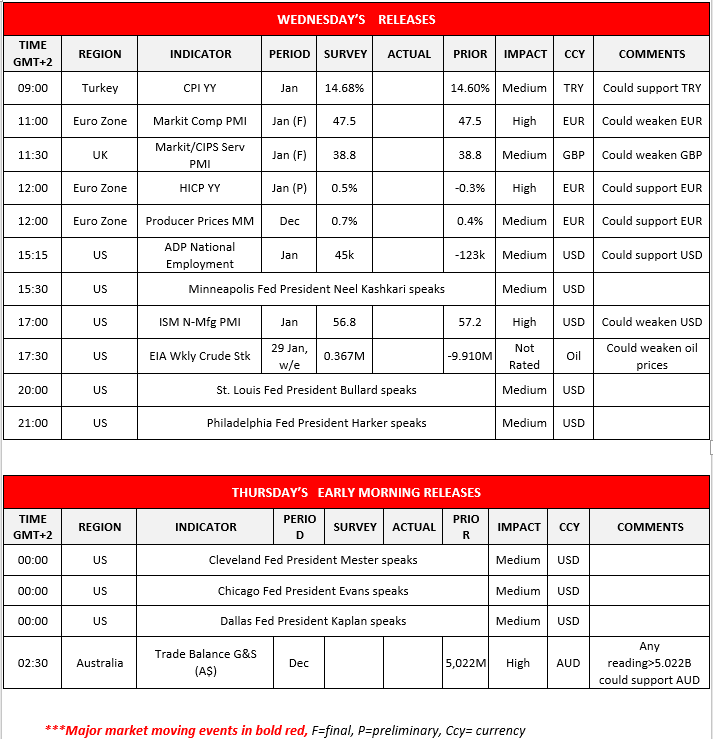
Other economic highlights today and early Tuesday:
Today during the European session, we note Turkey’s CPI rates for January, UK’s ad the Eurozone’s composite and services final PMI readings for January as well as Eurozone’s producer prices for December, while we highlight Eurozone’s preliminary HICP rate for January. In the American session, we expect the ADP national employment figure for January and the ISM non-manufacturing PMI for the same month to gather substantial interest, while oil traders may be more interested in the release of the weekly EIA crude oil inventories figure. Please note that during the late American session St. Louis Fed President Bullard, Philadelphia Fed President Harker, Cleveland Fed President Mester, Chicago Fed President Evans, Dallas Fed President Kaplan are scheduled to speak. During tomorrow’s Asian session, we note Australia’s trading data for December.
US Index H4 Chart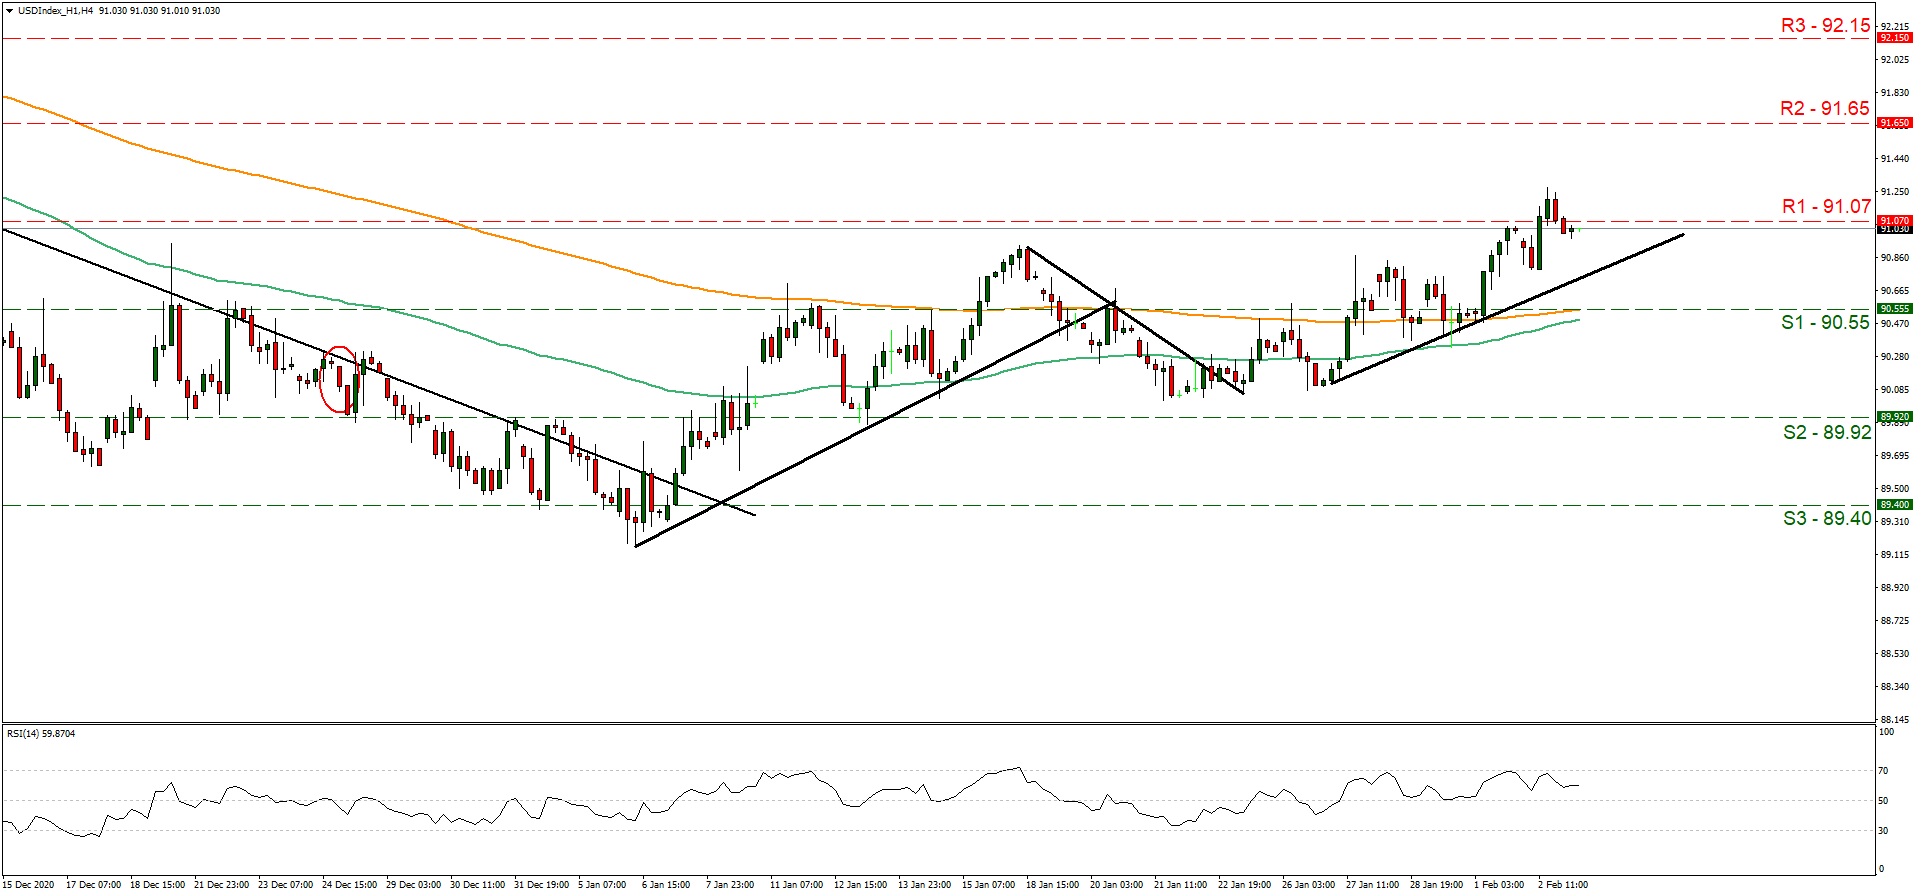
Support: 90.55 (S1), 89.92 (S2), 89.40 (S3)
Resistance: 91.07 (R1), 91.65 (R2), 92.15 (R3)
WTI H4 Chart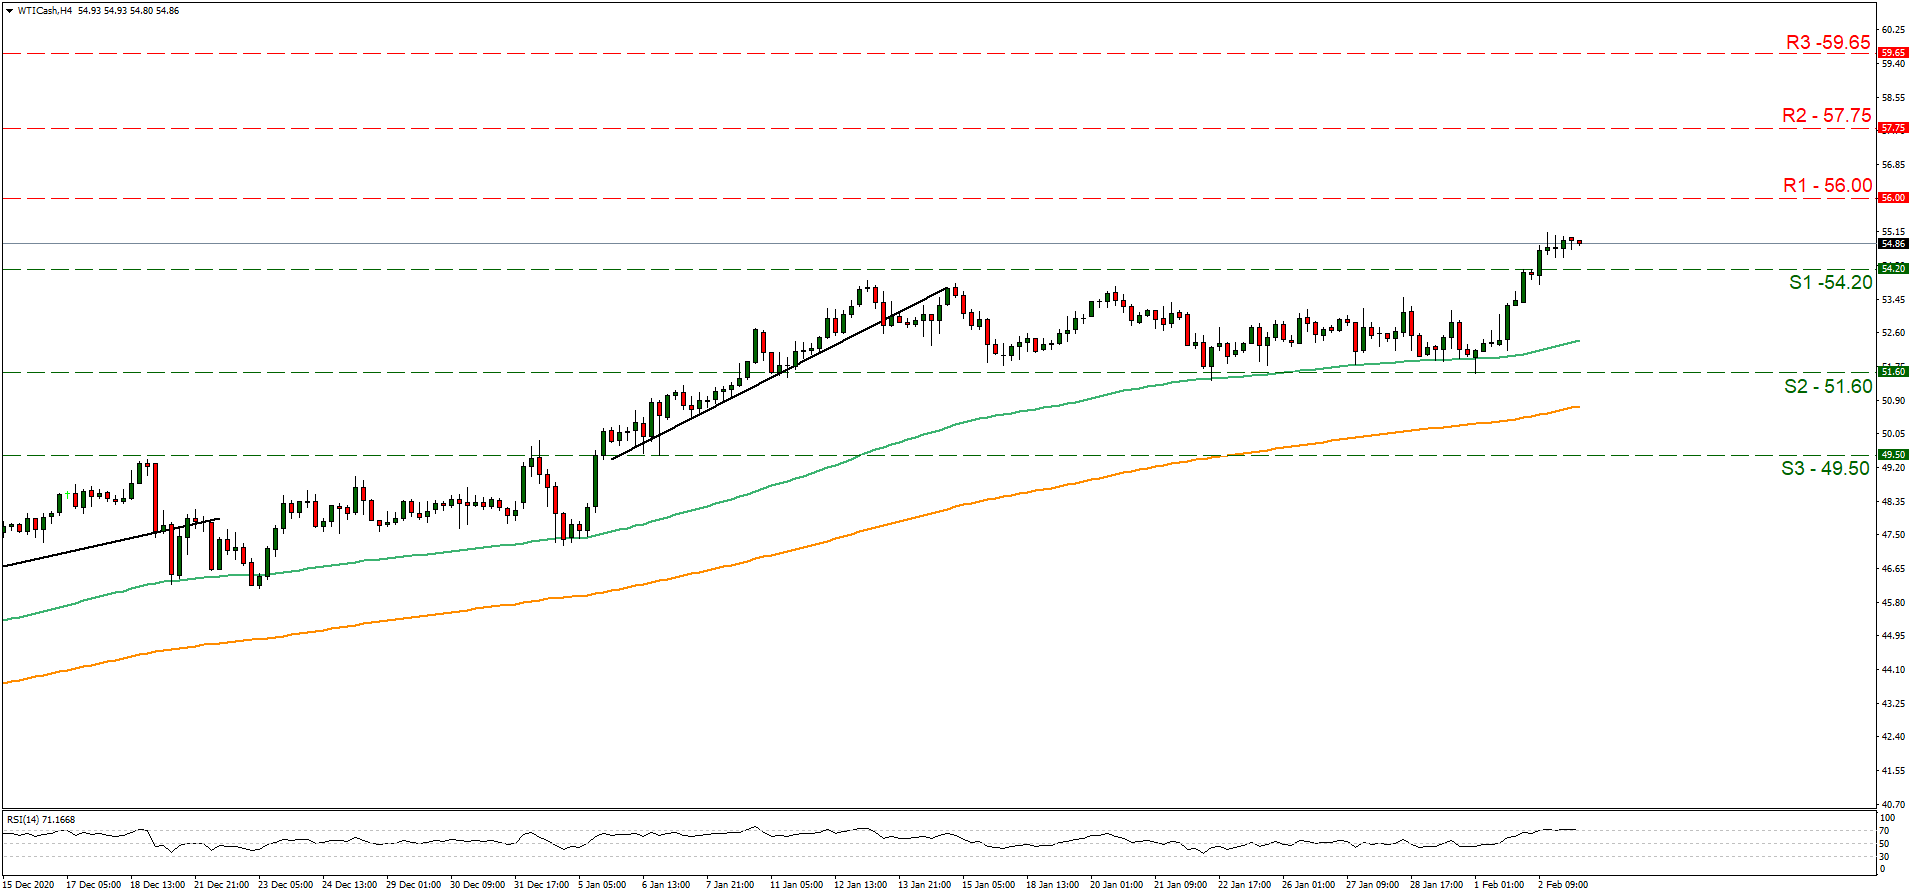
Support: 54.20 (S1), 51.60 (S2), 49.60 (S3)
Resistance: 56.00 (R1), 57.75 (R2), 59.65 (R3)