
Record Increase in Funds for Summer Spending Courtesy of Uncle Sam
Summary
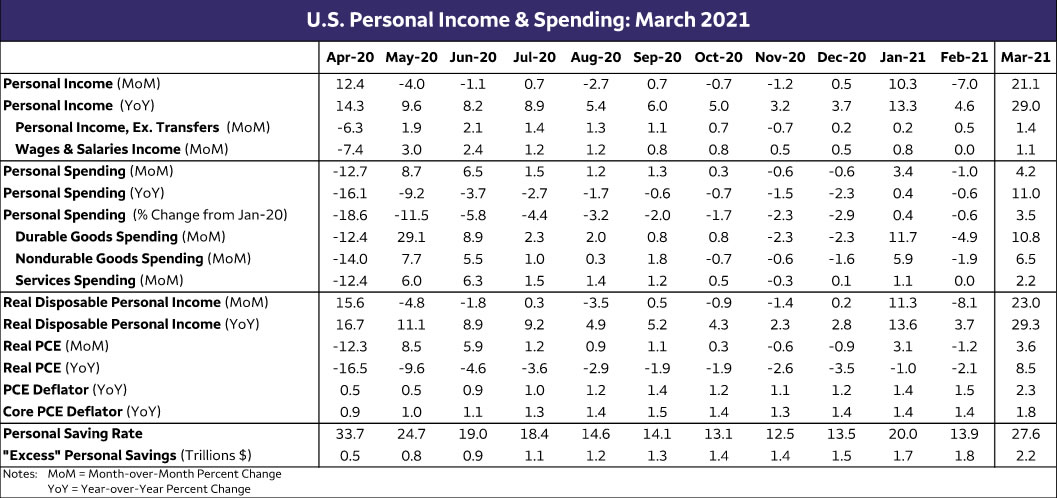
Some households may still be struggling, but in aggregate, consumers have more money than they know what do with. Personal income soared the most on record in March as the saving rate shot up to 27.6% and spending “only” increased 4.2%—the best month for spending since last June.
Don’t Spend it All in One Place
For the second time in three months, U.S. consumers received stimulus funds from the federal government. While some households are no doubt still struggling, in aggregate, consumers are raking it in faster than they can spend it in a continuation of a trend that has been in place for almost a year. In a recent special report, Show Me the Money, we talked about how some of these funds may be flowing into places other than savings accounts. Still, the sheer volume of cash and record saving rates over the past year suggest that as restrictions are lifted, the 10.7% annualized growth we saw in yesterday’s Q1 GDP report could be just the down payment in what we expected to be the strongest surge in consumer spending seen in a generation.
Although, the source of funds for income growth over the past year has widened to include (at various points) wages and salaries, rents and proprietors’ income as the economy has rebounded. While this dynamic continued in March, this month’s main story was mostly about the stimulus.
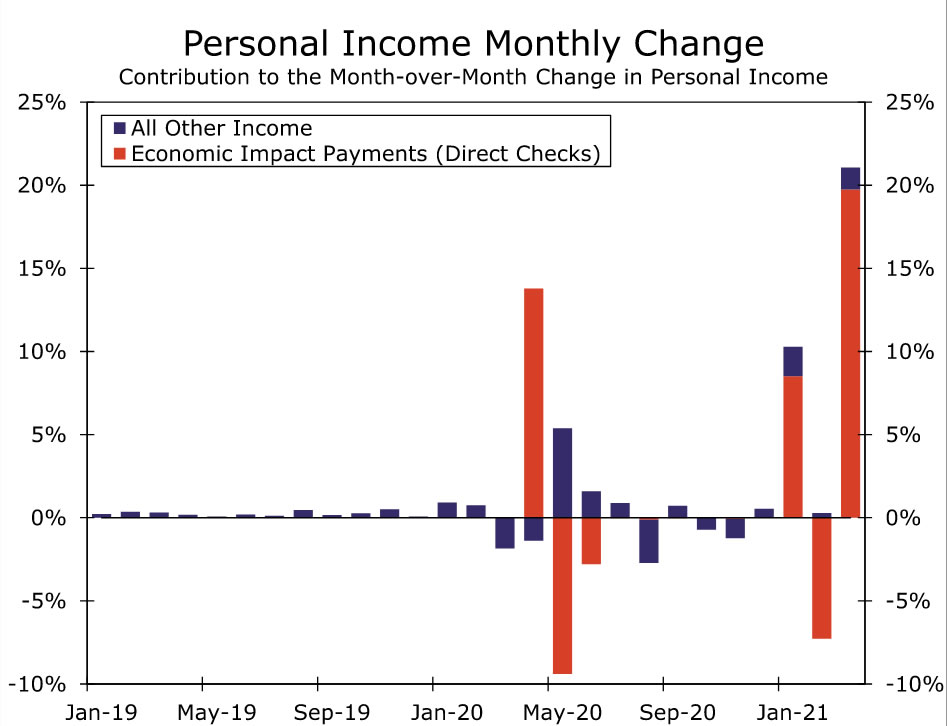
Of the overall 21.1% gain, most of it was attributable to transfer payments from the government (see chart). Wages and salaries did rise though, up 1.1%. For spending to be sustainable, sustained momentum in this category is critical, and as the labor market recovery continues to gain momentum this is more viable now than it was during the first CARES Act stimulus check hit around April 2020.
Income Is Growing Organically Too
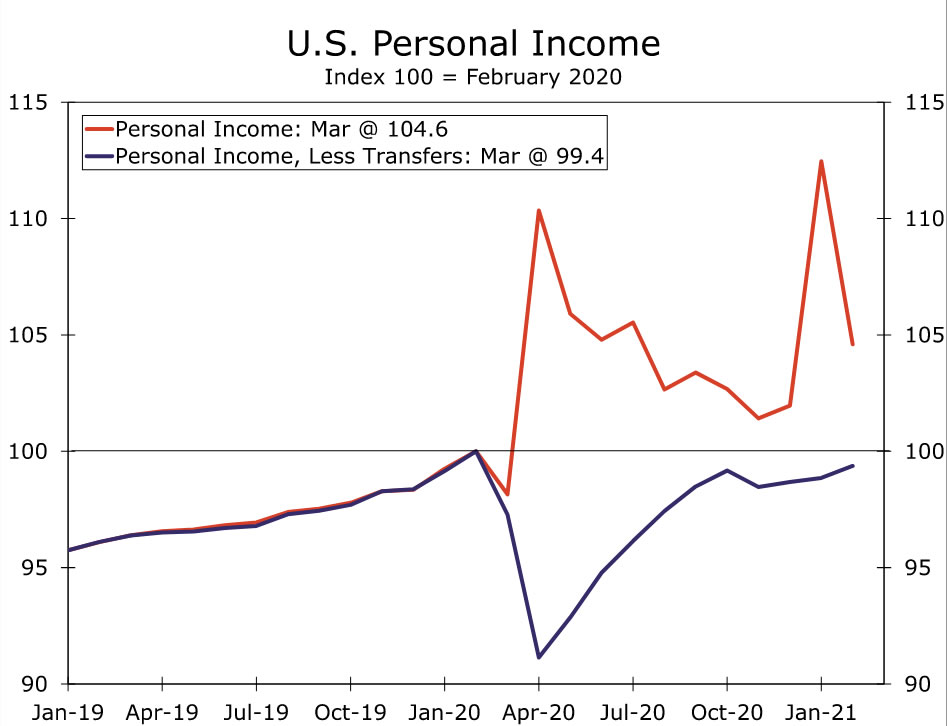
Due to the stimulus-fueled income gain, we will see scope for some moderation in spending next month. There is an impression in some circles that the growth in income is entirely a function of transfers, and that is a bit of a misnomer. Even after the stimulus effect, income is more or less where it would have been in the absence of the crisis (see chart). Again, it is critical to note here that while this is true in aggregate, many leisure and hospitality workers and others whose livelihood depends upon close personal contact jobs have had an awful year. This explains how millions are still relying on enhanced unemployment benefits as a source of income, even as some employers in other industries report difficulty finding labor. Households in general are flush with cash and many of those who held onto their job have seen their income rise.
The personal saving rate shot up to 27.6% in March, exceeded only by the rate attained in April of last year when the CARES Act boosted incomes, and when consumers had fewer options for where to spend it. On the heels of this latest windfall, our running tally of excess savings rose to $2.2 trillion.
PCE Inflation Spikes to 2.3%, But That Was Expected
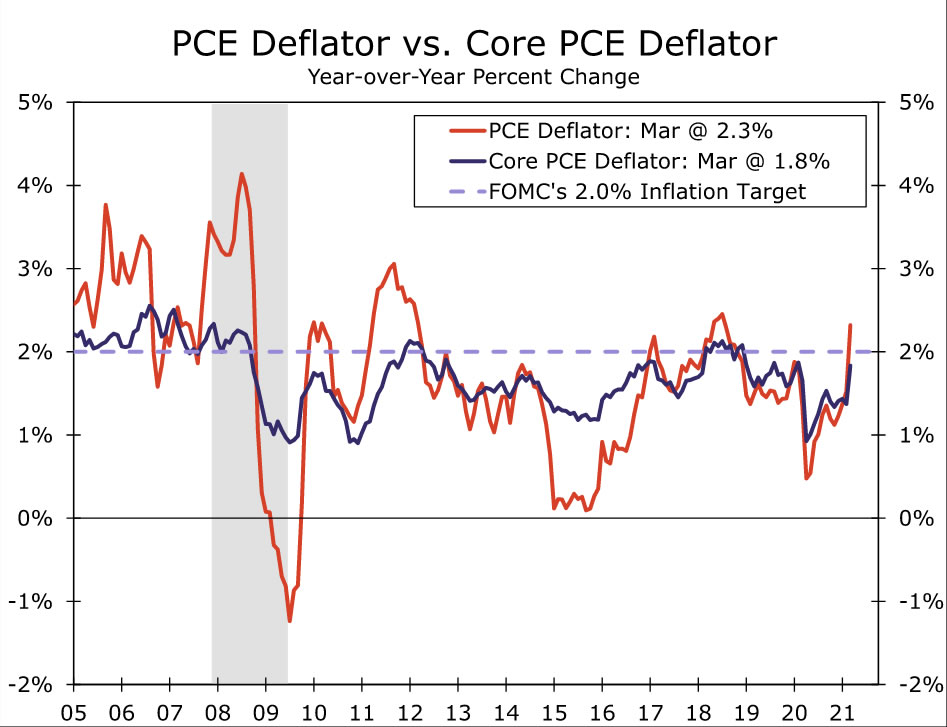
Inflation also heated up in March. The PCE deflator, which is the Fed’s preferred measure of inflation, rose 0.5% compared to February. The year-over-year rate rose to 2.3% from 1.5% a month earlier, helped by low base comparisons after lockdowns last year weighed on activity and prices (see chart).
Excluding food and energy, core prices rose 0.4%, pushing the year-over-year rate to 1.8%. Low base effects are set to flatter the year-over-year comparisons of inflation over the next couple of months, which is what the Fed has deemed will have transitory effects on prices. But there is growing evidence that inflation is heating up now with business and consumer expectations moving higher and supply chain problems persisting amid an expected boom in consumer demand. That said, it’s too soon to know if current price pressure is the effects of the reopening that may soon subside or will in fact lead to sustained higher price growth past the sharp bounce in activity.
Our own forecast has the PCE deflator approaching 3% on a year-over-year basis mid-year before settling lower. With the Fed making it clear again at this week’s policy meeting that they want to see a sustained pickup in inflation rather than a temporary increase, we expect the Fed to remain in wait-and-see mode for months to come and keep policy accommodative.


