According to the Dollar Index the USD finished the day break even on Wednesday, possibly leaving room for reaction upon the busy Thursday economic calendar. Inflation data has always been of great interest to traders due to the fact that it can move the market substantially and create openings but also because they provide information on where the economy stands at the moment. Evidently, US consumers have more money to spend, retail sales are on the rise as well as factory orders and housing which are all contributing to a large GDP. Yet market participants still view the US jobs report for May released in the previous week as a mismatch, with higher NFP figure expectations. An interesting report by the WSJ states that the pandemic forced businesses to invest more in technology which could be limiting employment at the moment. On the contrary and from our point of view the U.S. economy is currently thriving in terms of productivity and the positive outlook seems to support even higher wages and inflation. Yet similar to what happened in the previous week with the jobs report we suggest that the market could be more event driven thus traders and big financial institutions could be picking their trades at this stage. Finally the market will also focus on the weekly Initial Jobless Claims on Thursday possibly treating it as the cherry on the pie. We would like to note that if the CPI rates motivate traders to place orders instruments like Gold and US indexes can also uplift volatility.
At the moment Gold is trading between our (R1) 1900 resistance and our (S1) 1883 support. If the precious metal comes under buying interest then it could re approach and test the (R1) 1900 resistance which seems to be a notable challenge for the bulls in the past days. Higher than that the price action can surge towards the (R2) 1913 which was reached briefly in the later part of May but was not overcome by the buying momentum. Our highest resistance for this chart is currently the (R3) 1927 and could become a target if the buying persists. In the opposite direction if the market is to move downwards the price activity could check the (S1) 1883 line and with a strong move we can see the market engaging the (S2) 1871 support. Our level at the bottom is currently the (S3) 1860 and could be reached in an increased selling order scenario. The RSI indicator below our chart is gradually moving downwards and in our opinion mirrors the selling in the latest sessions. Gold is seen as a hedge instrument for higher prices (Inflation) thus caution is advised as its sensitivity to the matter may be displayed during the US inflation data release today.
EUR traders locked in for ECB rate decision
In the past we have seen similar events create significant volatility for the EUR and in some cases swinging reactions for the currency. Yet the circumstances are very different from the past and the markets focus maybe turning to specific subjects in the upcoming ECB meeting. Traders, may turn their attention to signs of an imminent slowdown to ECB’s bond buying program even though the bank is expected to keep its interest rates steady. Moreover, if the future forecasts of the bank indicate unexpected information then once again the EUR may come under strong market volatility against many of its counterparts. Overall, the Eurozone’s GDP, Inflation data and Consumer Confidence readings have improved in the past months which tends to create the expectations that something new could come up during today’s ECB press conference or report.
EUR/USD made another failed attempt to conquer the (R1) 1.2220 level yesterday and managed to climb to a new weekly high price but failed to break higher. In our view the (R1) and the (R2) 1.2265 resistances remain the main focus for the bulls as a breach above them could lead to a yearly high price for the currency pair and will also signal the EUR’s continuous superiority against the USD. In this case we could be seeing traders move their attention to the (R3) 1.2310 barrier. On the other hand a drop lower could force EUR/USD towards the (S1) 1.2160 level which is a considerable level and may prove hard to breach downwards. In the scenario of a breach for the sellers then the road could be prepared for the (S2) 1.2125 line to come into play while the (S3) 1.2085 could be used as our final support. The RSI indicator below our chart is nearby 50 implying traders at the moment could be indecisive. In our view the market’s attention towards the currency pair could be uplifted as we near the ECB events later today.
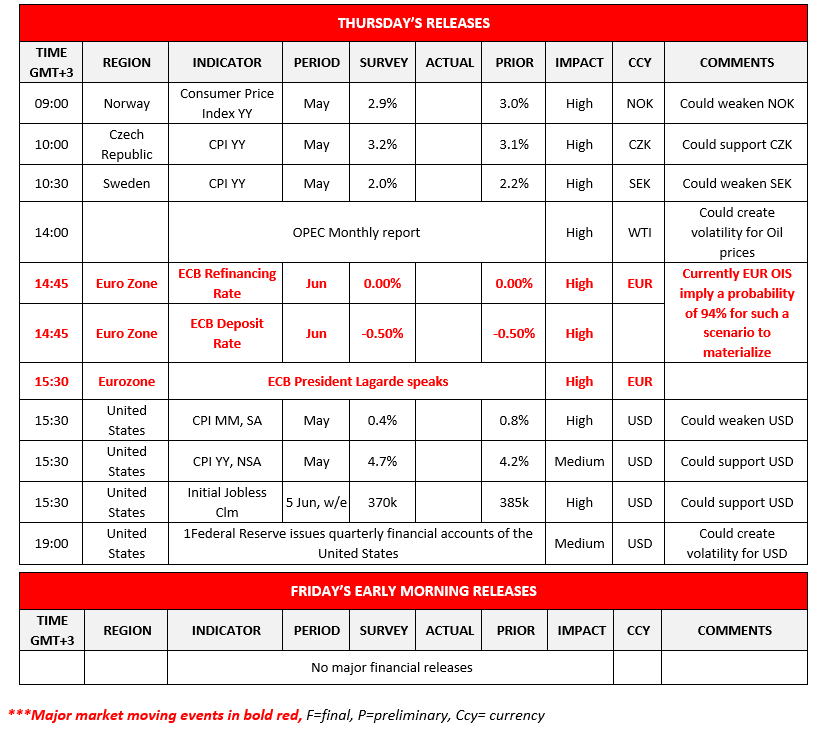
Other economic highlights today and the following Asian session:
Today during the European session, we get Norway’s, Czech Republic’s and Sweden’s CPI rates for May while later on the market will receive the monthly OPEC report. After that the ECB Interest rate decision and Monetary Policy Statement come up, with the ECB press conference starting less than an hour later. In the early US session we get the US Inflation data for May and at the same time the weekly Initial Jobless Claims figure. Finally in the US session the Federal Reserve issues quarterly financial accounts of the United States.
XAU/USD H4 Chart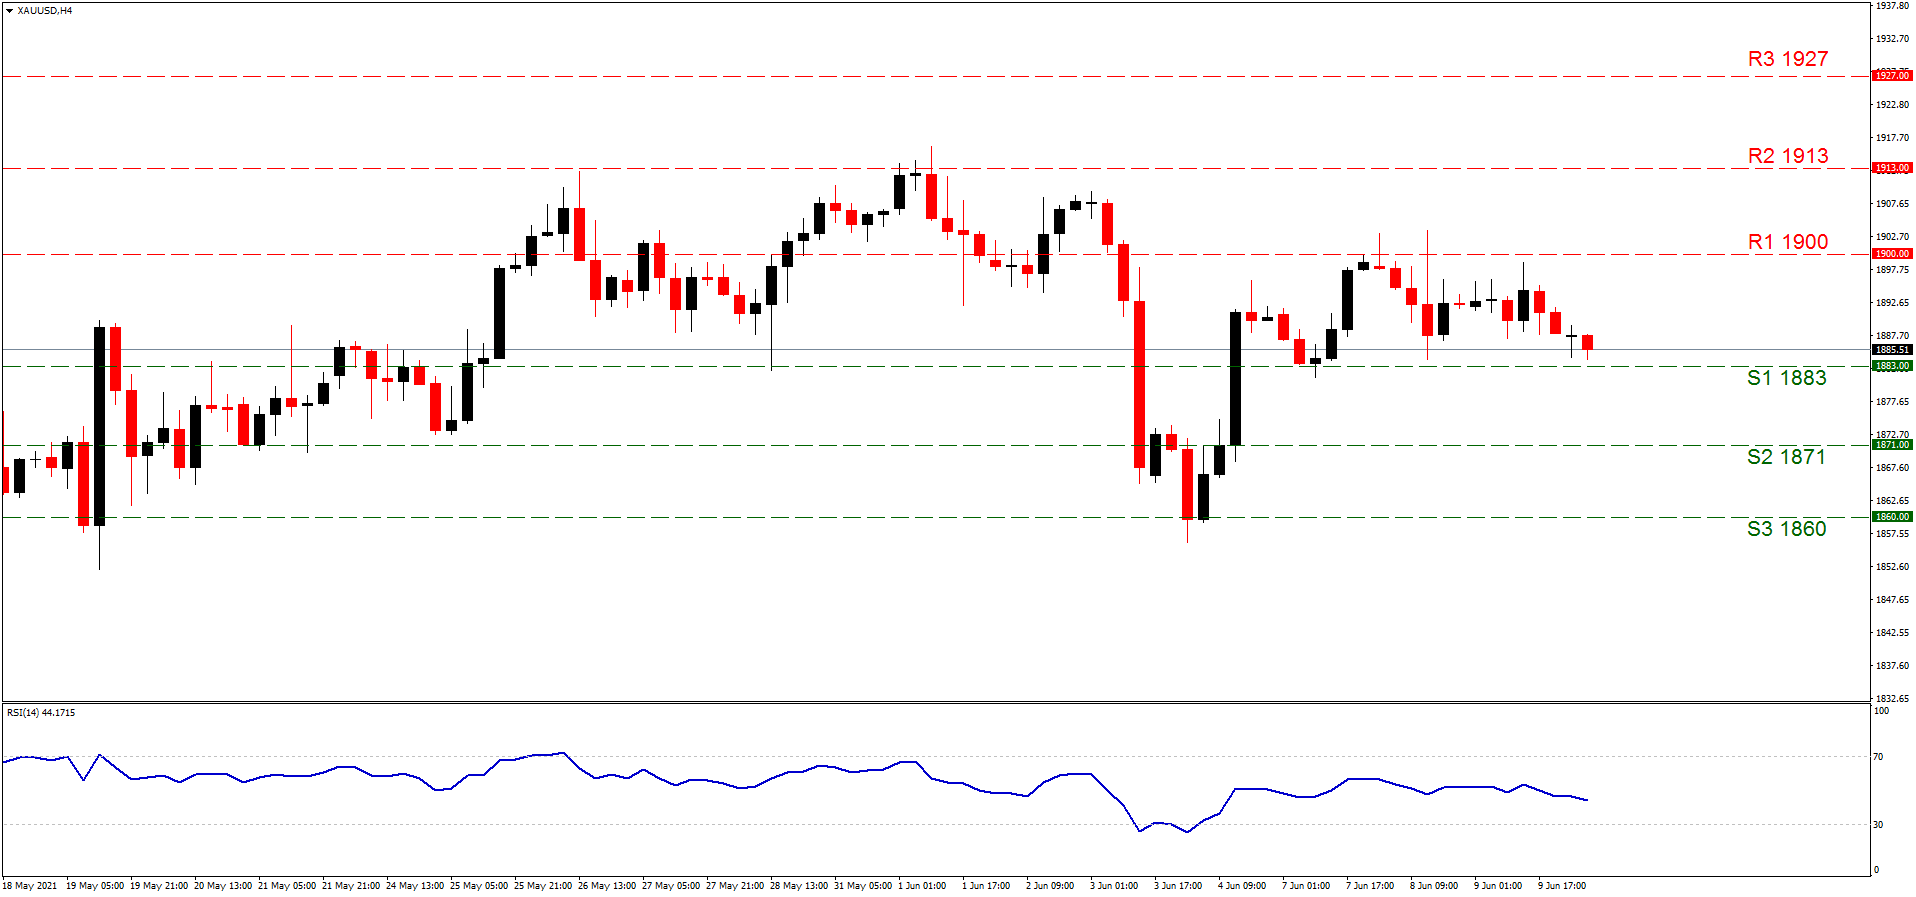
Support: 1883 (S1), 1871 (S2), 1860 (S3)
Resistance: 1900 (R1), 1913 (R2), 1927 (R3)
EUR/USD H4 Chart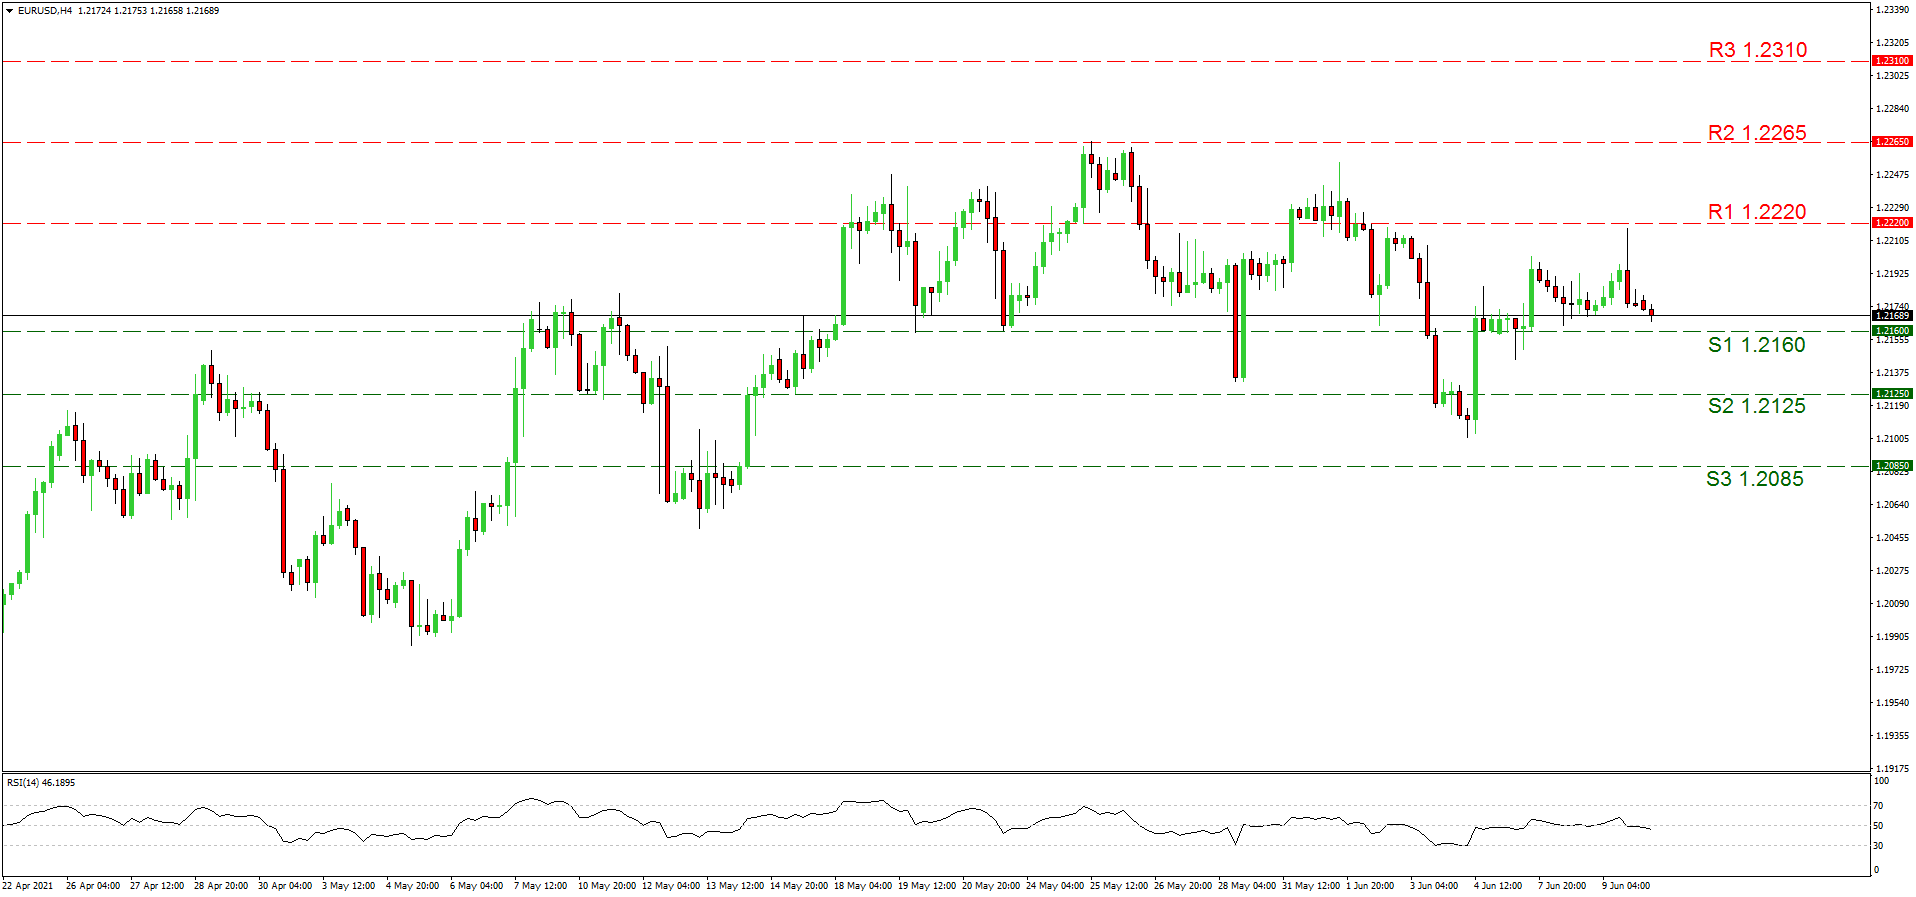
Support: 1.2160 (S1), 1.2125 (S2), 1.2085 (S3)
Resistance: 1.2220 (R1), 1.2265 (R2), 1.2310 (R3)