
The Gold market ended lower for the third consecutive week, while it seems to be losing ground so far in the current. Even though last week’s economic calendar was rather packed and important, it may have failed to create substantial volatility for the Gold market leaving traders disappointed. However, with a rather interesting week ahead and Gold’s highly unpredictable nature, we turn our attention to the present moment. This report can be used as a Gold trading manual as it will combine fundamental and technical analysis.
One way to trade the Gold market can be exclusively during important economic releases. The most important release from our point of view, comes on the 11th of May with the US Inflation data for April. Rising inflation has been a great headache for most economies around the world but especially in the US, with the matter being of great importance to the Federal Reserve. At the moment, the forecasts are for all, the monthly, yearly and core rates to tick down compared to the previous month, yet any surprise upon release can have a stronger impact on Gold prices. Inflation data releases have traditionally been used as a target for Gold traders and this event can produce significant volatility for Gold prices. The precious metal tends to react to the news, as bullion is seen as a hedge against higher inflation, which equals higher good prices. Higher inflationary rates tend to push Gold prices upwards and vice versa. However, traders are advised to be extremely cautious when engaging the market, as Gold prices can also be subject to wild swings before and after the release. On a separate note, on Thursday the 12th of May we get the weekly US Initial Jobless claims and on Friday the 13th we get the interesting Preliminary UoM consumer sentiment figure for May. Finally, traders should note Tuesday the 17th of May, with the Key Retail Sales and the Industrial Production rates both for April.
As Inflation in the US reached record high levels in the past months, the FOMC rushed to impose rate hikes just like the one of 50 basis points announced in the past week. Interest rate hikes are used to control the growth of the economy and to prevent it from overheating. On the day, Gold prices moved higher while the Greenback was on the backfoot, confirming the adverse relationship between them may still be in place. However, from our point of view, Gold continues to be driven by contradicting forces at the moment. The Gold market maybe caught in between Economic and Geopolitical tensions which are considered by many to remain with us for the near future. A global rate hike environment may not be so favorable to the Gold market while. Gold is trading higher compared to where it started at the beginning of the year but had peaked in March and has lost ground ever since. On the other hand, agriculture and energy commodity prices have remained higher recently, indicating investors may be gravitating towards those asset classes which are driven by the Russian war in Ukraine and supply bottleneck matters that have persisted as a result of the pandemic.
Finally, the fast-moving Gold market is highly appreciated by traders including some speculators. A gold trader should keep in mind that the market may be prone to abrupt and emotional price swings as a result of speculation. This is a reason for traders to take extra care when engaging the market in order to avoid being exposed with losses. In our opinion, trading Gold should be accompanied by swift and definite decision making while a predetermined exit point must be considered prior to entering the market.
Technical Analysis
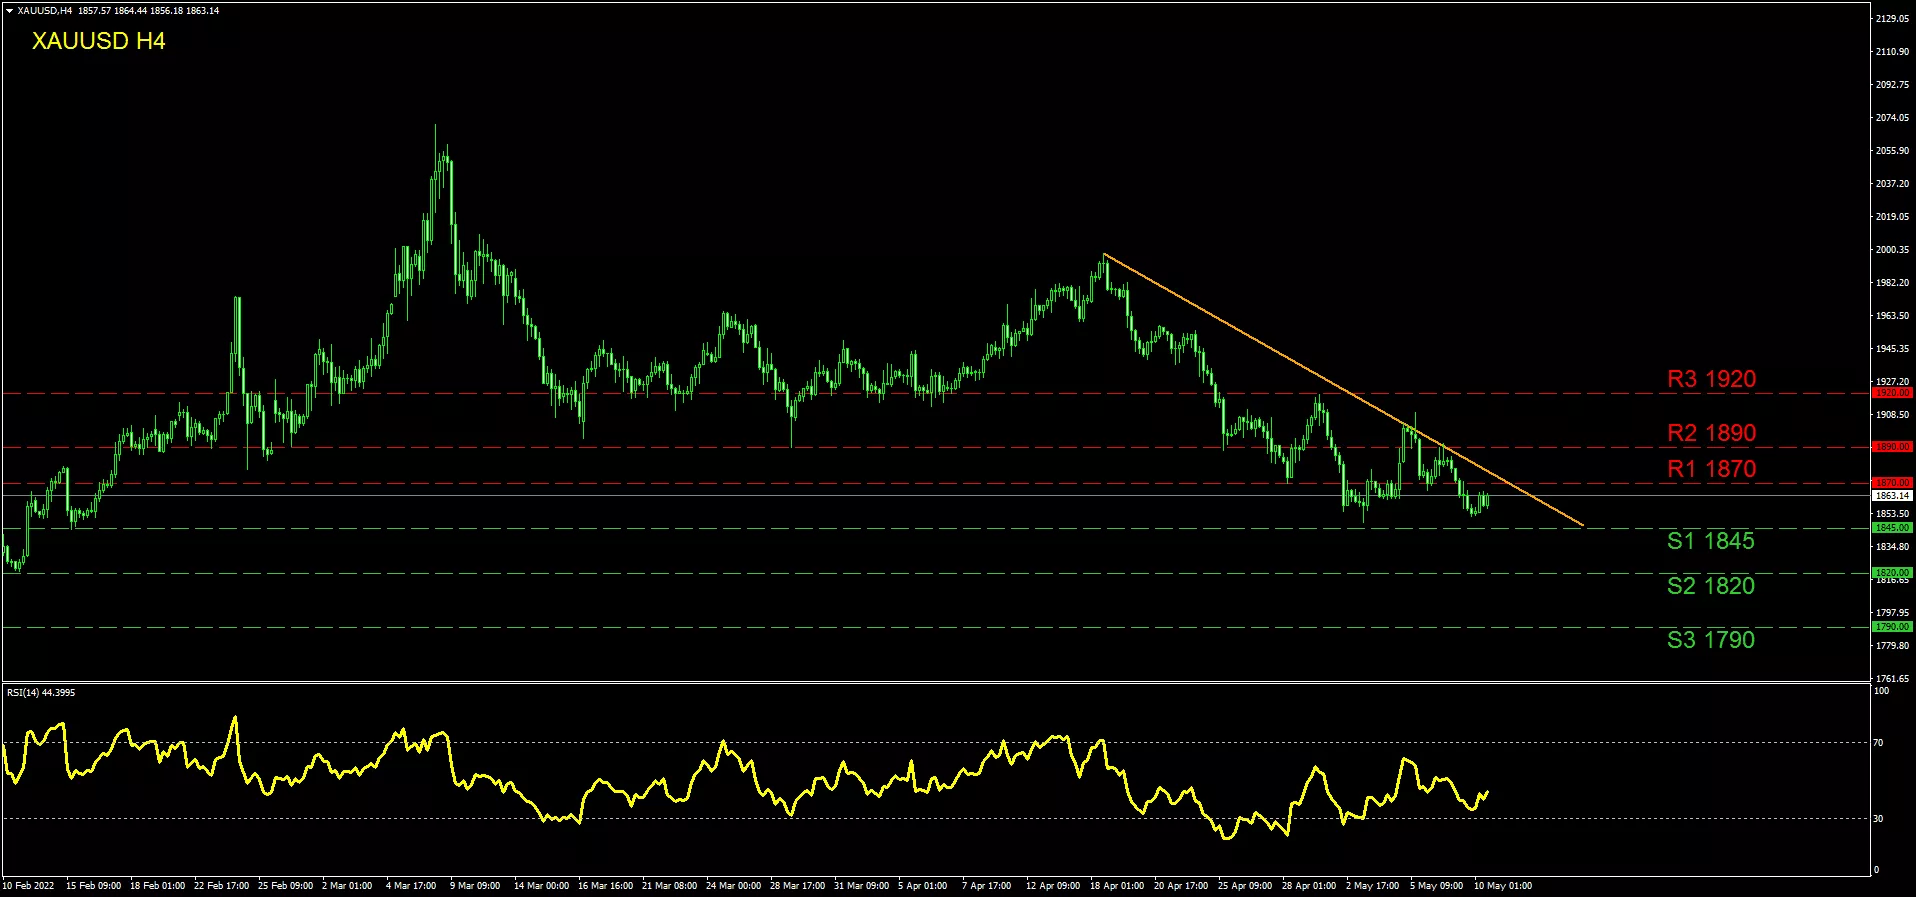
XAUUSD Daily
Gold is currently trading between our (R1) 1870 resistance level and our (S1) 1845 support level. In the past days, Gold traded higher breaking above the (R2) 1890 line and even surpassed the 1900 round number barrier but eventually returned to lower grounds. However, for an ultimate bullish scenario we would consider the (R3) 1920 resistance barrier as a key indicator for bullish appetite. In the opposite direction, a breach below the (S1) 1845 support could signal more bearish interest to come, making the (S2) 1820 support a probable target. In the scenario of notable selloff, we could see the (S3) 1790 being engaged. Very notably, the RSI indicator had made a move towards the 30 line but rebounded and is currently moving across the 43-level suggesting some stabilization, in the short term. Yet in our view, Gold continues to trade in a downward trendline which is highlighted with the orange descending line on our chart. A possible move above the orange line could signal a breach of the current downward trendline and that a sideways motion may be prevailing. Once again in order for the trend to turn bullish, our personal view would be for the (R3) 1920 line to be tested.


