
Gold managed to move in positive territory in the previous week, rebounding from a 4-week losing streak. Yesterday, Monday the 23rd Gold jumped to a new weekly high price reigniting further bullish expectations for the precious metal. However, the market remains overflooded with great uncertainty over various subjects making the future direction of gold’s price an enigma for most traders. In this report, we will carefully analyze and breakdown the most important information needed to trade the Gold market carefully, including both technical and fundamental aspects.
A factor that may have supported Gold prices in the short term, may have been the weakening of the greenback. In the second half of May, the USD Index has been captured by some bearish tendencies. This may be a technical correction for the Index, as it has been ascending for the past 6 consecutive weeks until the 8th of May. Yet traders may be content to observe the adverse relationship the metal keeps with the USD, as it could potentially support Gold’s price further. The US economic releases in the past week may have contributed somewhat to the Dollar’s weakening, with a few data including the NY Fed manufacturing, the Existing Home Sales and the Philly Fed Business Index figures moving lower compared to previous months.
On a different note, a major subject that seems to counter the general investor confidence and at the same time lift economic risk supporting Gold prices, are the ongoing supply chain disruptions. Covid-19 restrictions in some parts of the world along with the war in Ukraine, have kept this challenge alive in the medium to long-term, putting limits on business activities. In order to mend the gap with supplies, some large companies are now investing huge amounts of funds to receive supplies domestically or to be able to create them themselves. Yet, capital expenditures of these firms are increasing drastically and already higher inflationary pressures, maybe increasing costs to the point where profitability maybe tested. These firms are investing in the future and can perhaps become self-sufficient, bringing down costs in the long term but in the meantime seem to be pushing the margins to the limit.
In addition, the idea that some major economies might be heading into a recession is echoed more and more in the most recent weeks. Even though we might need actual figures to confirm for such a scenario, some economic slowdown has been observed in China, the UK, the US and the Eurozone increasing possibilities for solidifying the downturn. However, in our view the prementioned subjects are also running in the background possibly making things somewhat worse than they really are.
The economic releases in the following days are rather important and traders should keep an eye on the new figures, as they could create volatility for Gold. During the 25th of May we get the FOMC minutes for its meeting in May. On the 26th of May we get the highly important US GDP 2nd Estimate rate for Q1 along with the weekly Initial Jobless claims figure. On the 27th of May, we get the US Consumption Adjusted and Core PCE Price Index rates both for April along with the Final UoM Consumer Sentiment figure. Finally, on Monday the 31st we get the noteworthy US Consumer Confidence figure for May.
Technical Analysis
XAUUSD Daily
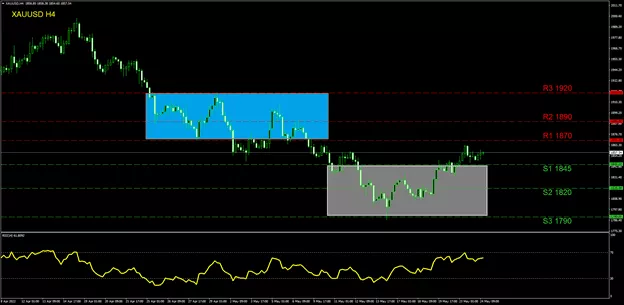
Since the 16th of May Gold has managed to perform consecutive sessions upwards turning previous resistances into support levels. If this trend continues, we may see the price action engaging the (R1) 1870 resistance level which was used previously in the start of May. Above the (R1) we see the price action moving into a range that was used for most of the period towards the end of April and the beginning of May, which is highlighted with blue on our chart. On the other hand, if a trend to the downside prevails, we may see the (S1) 1845 support level being tested. Below the (S1) we may see the price action falling into territory that was traded for 10 consecutive days in May. which led to a momentary touch of the (S3) 1790 support level, which is also the lowest point Gold has dropped to since the start of the current year. Despite the recent upward movement, Gold in our opinion remains in a selling momentum since the start of March. For us to change our current selling view to a buying one, we would like to see a clear testing of the (R3) 1920 barrier, setting it as a barometer for the strength of the bulls. Yet on a H4 chart basis, the RSI indicator continues to move above 63 implying some bullish interest may be in play.


