
Gold’s price was on the rise since our last report yet seems to remain rather lazy given the relative inactivity of the greenback in the past few days.
The negative correlation of the two trading instruments came once again on display on Friday as the precious metal’s price dropped in response to USD’s strengthening. The driving force behind the movement was the release of the US employment report for July, which showed some solid rates and figures for the US employment market in the past month.
It was characteristic that the NFP figure did not drop as expected, instead jumped to twice the number of jobs the market anticipated to be released, reaching 528k. Also the unemployment rate ticked down implying that the US employment market remains tight and the average earnings growth rate remained unchanged instead of slowing down on a year on year level, as was expected, implying that wages are to continue to feed inflationary pressures in the US economy.
On a monetary level, the release intensified market expectations for the Fed to continue to hike rates at a fast pace. Furthermore we would note that Fed Governor Bowman stated, that additional 75 basis points rate hikes should be considered from the Fed in order to bring inflation down to 2%.
Overall and given that the Fed’s intentions to drain the market from excess liquidity remain unchanged, even with the risk of the US economy entering a recession, we may see the market sentiment remaining risk averse, which could initially support the USD and thus weaken the shiny metal, given also that similar intentions were expressed from a wider number of central banks regarding the tightening of their respective monetary policies.
The next big test is expected to be the release of the US CPI rates for July tomorrow the 10th of August. The headline rates are expected to slow down both on a month on month level as well as on a year on year level and reach 0.2% mom and 8.7% yoy respectively. Should the actual rates slowdown as expected, it could signal a big win for the Fed and its efforts to curb inflationary pressures.
Thus the pressure on the Fed to continue to hike rates at a fast pace could ease, as the slowdown may imply that inflation has peaked and may have started to roll back down to the bank’s target of 2% yoy. On a market reaction level the release, if the forecasts are realised, could weaken the USD and at the same time strengthen gold’s price, given the two instrument’s negative correlation.
On the other hand the precious metal could find itself in a rather peculiar position as it is also used as a hedging instrument for inflation, while increased volatility may be present for the bullion at the same time, especially should the actual rates differ from the market expectations.
On a fundamental level, we would like to note the tensions in the US–Sino relationships and especially China’s intentions over Taiwan. It’s characteristic that Taiwan’s foreign minister Wu warned earlier today in a press conference that “China has used the drills … to prepare for the invasion of Taiwan” according to Reuters and urged “international support to safeguard peace and stability across the Taiwan Strait”.
It should be noted that the Taiwan straits are of the busiest shipping routes worldwide and tensions could halt trading activities. We highlight the possible adverse effects for the global economic outlook of a possible military operation of China in Taiwan but also the possibility of additional sanctions being deployed against China from the US.
Technical Analysis
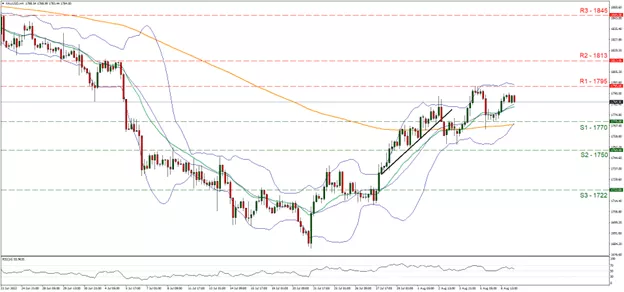
XAUUSD H4 Chart
Support: 1770 (S1), 1750 (S2), 1722 (S3)
Resistance: 1795 (R1), 1813 (R2), 1845 (R3)
Gold’s price rose since our last report yet seems to have hit a ceiling at the 1795 (R1) resistance line and calmed down by correcting and stabilizing a bit lower.
We tend to maintain a bias for a sideways motion of the precious metal’s price between the 1770 (S1) support line and the 1795 (R1) resistance line currently. It should be noted though, that the RSI indicator below our 4-hour chart is above the reading of 50, thus some bullish tendencies should not take us by surprise, given also the consecutive higher troughs and peaks that characterize the precious metal’s price action since the 21st of July.
Also indicative of the bullish tendencies is the crossover of the more sensitive 20 moving average over the 200 period moving average. On the other hand, the upper and lower Bollinger bands seem to be converging, implying some lower volatility for the precious metal’s price.
Please note though that fundamentals and the release of the US CPI rates for July could alter gold’s direction either way, depending on the outcome. Should the bulls take over, we may see Gold’s price breaking the 1795 (R1) resistance line that capped its ascent higher on the 4th of August and aim for the 1813 (R2) level that kept the bulls at bay, on the 4th of July. Even higher, we note the 1845 (R3) resistance barrier that has not seen any price action since the 23rd of June.
Should the bears take over, we would expect gold’s price to initially break the 1770 (S1) support line that held its ground against the downward pressure exercised by the bullion’s price on the 5th and 8th of August and take aim for the 1750 (S2) support level. Should the S2 be broken we note as the next possible target for the bears the 1722 (S3) support hurdle.


