
Since November 2021, Bitcoin (BTCUSD) has been experiencing a strong downtrend losing over 70% from its all-time high. Although, sellers may not have capitulated yet, current trends are “typical” for the end of bear markets. According to the data from the on-chain analytics firm Glassnode, seller behavior suggests that a macro price bottom is forming.
Analyst: seller exhaustion “near” bear market lows
In the latest hint that Bitcoin’s bear market is nearing its end, Glassnode has revealed that the network is currently weathering a “perfect storm” of low volatility and high on-chain losses.
The Seller Exhaustion Constant is calculated as the percentage of Bitcoin’s total circulating supply in profit multiplied by its volatility over the last 30 days. According to the historical data, such lows are rare, having appeared seven times before. Six of those times, upside volatility led to the end of Bitcoin’s bearish trend.
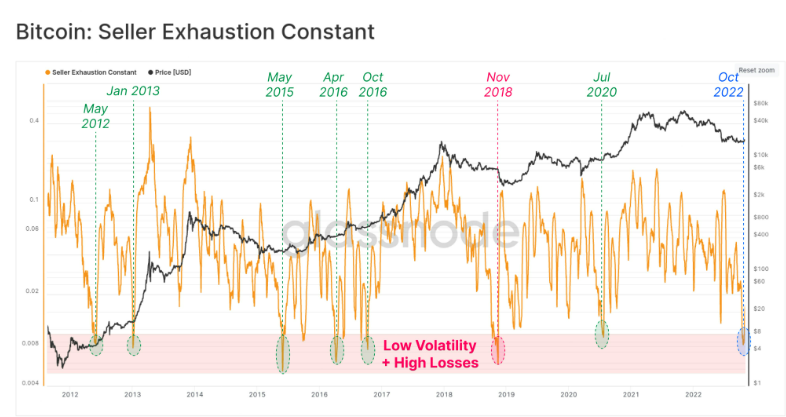
Bitcoin Seller Exhaustion Constant chart. Source: Glassnode
Fed monetary policy might be the problem
The Federal Reserve approved a fourth-straight rate hike of 75 basis points on November 2 as part of its aggressive battle to bring down the inflation plaguing the US economy. The hike brings the central bank’s benchmark lending rate to a new target range of 3.75% to 4%, making it the highest rate since January 2008.
In a news conference following the meeting, Fed Chairman Jerome Powell highlighted the rising probability of an upcoming recession and acknowledged that the path to a soft landing had narrowed. Moreover, he added that the Federal Reserve had raised its target rate because “there are no signs of the inflation decrease.”
The Fed may remain hawkish, and this is not surprising. Powell noted several times that macroeconomic indicators have yet to stabilize. The labor market is overheated, as well as the housing market, despite falling demand.
As a result, the US dollar has skyrocketed after the conference pressing risk assets, with US100 (NASDAQ) losing 3.7% and Bitcoin down 1.6%.
If the Fed remains committed to its hawkish monetary policy, demand for risky assets, including Bitcoin, will decline, putting pressure on the price.
CPI data will decide everything
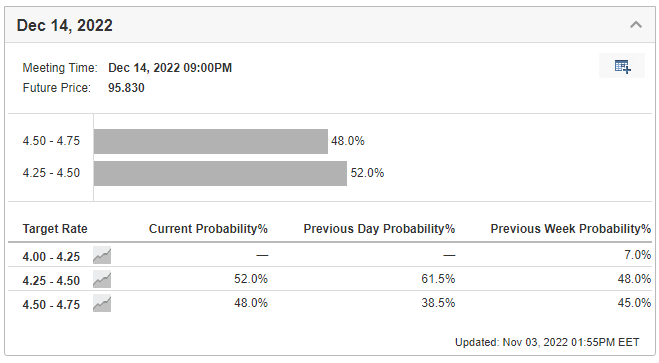
Currently, markets are undecided in their expectations regarding the Fed’s next move. According to analysts’ expectations, there is a 52% chance for a 50-basis-point rate hike versus a 48% chance for a 75-basis-point increase.
On November 10, the Bureau of Labor Statistics will publish the October inflation data, which will most likely decide the next Fed’s move. If the actual data overperforms or meets the expectations of a 0.4% m/m inflation increase, the Fed will most likely take more hawkish steps at the December meeting. That, in turn, would be negative for Bitcoin.
On the other hand, if the inflation growth decreases, the Federal Reserve will likely slow down the pace of the key rate hikes and BTC may turn up.
Technical analysis
US dollar index, daily chart
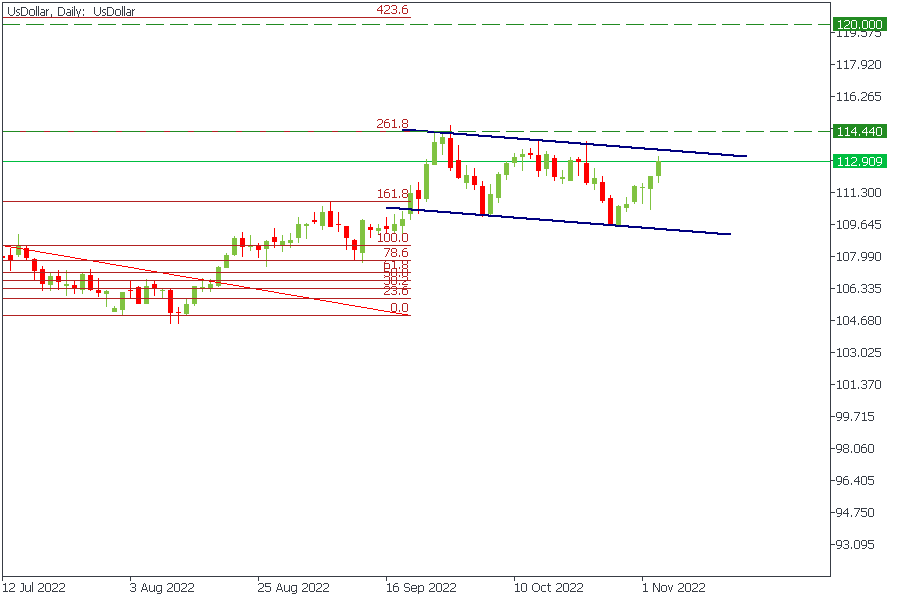
The US dollar index has formed a bullish flag on the daily chart. If the price breaks the resistance trend line, the index will most likely reach 120.00 in the near-term pressing risk assets, including the crypto market.
BTCUSD, daily chart
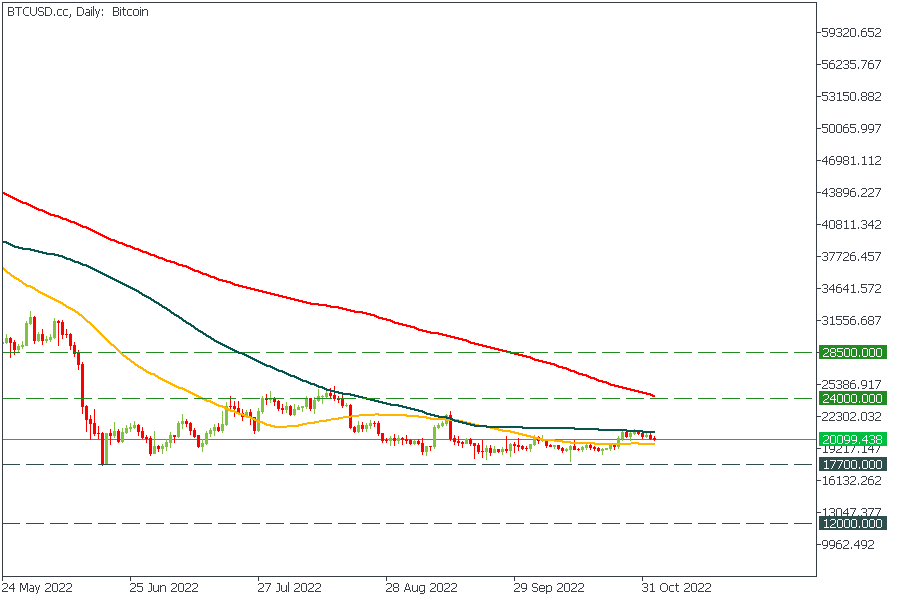
Bitcoin price is squeezed between the 50- and 100-day Moving Average. Investors should wait for the breakout and follow the trend.
If the price breaks above the 100-day MA, it will most likely reach $24 000.00. On the other hand, if the price loses 50-day MA, it will drop to $17 700.00.
Moreover, a Bitcoin breakout above $24000 will open the way to $28500 for the buyers. At the same time, a breakout below $17 700 would mean a further BTCUSD decline toward $12 000 support.


