Oil and Gold entered a holding pattern overnight with quiet range trading ahead of key data.
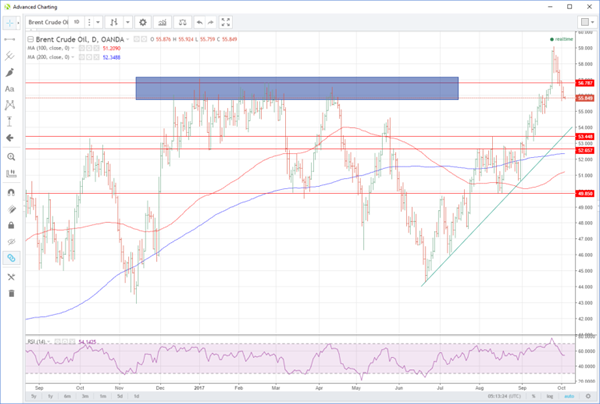
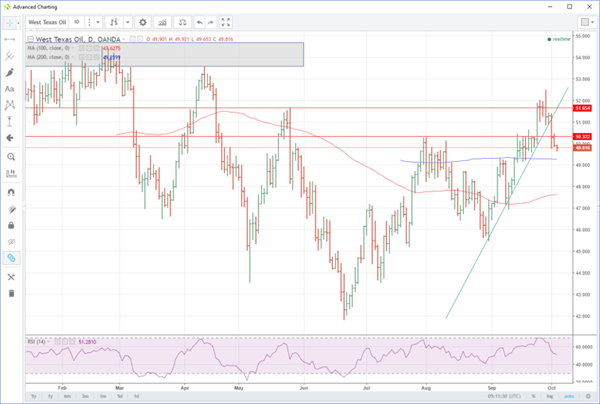
Oil prices ended Tuesday with more of a whimper than a roar, with Brent and WTI falling around 40 cents to open in Asia at 55.80 and 49.80 respectively. An unexpectedly large drawdown of 4.079 million barrels from the American Petroleum Institute (API) crude inventories, was more than offset by an equally large 4 million plus build in gasoline stocks. It appears that the overhang of speculative long positioning is continuing to overhang oil markets although one suspects this has now been substantially reduced over the past week.
Traders’ will be watching tonight’s official Department of Energy crude inventory data for more clues with the street expecting a small drawdown of around 0.5 million barrels. An unexpected increase from this number could see more short-term pain for speculative longs, particularly in WTI.
Brent spot is perched just above support at 55.50 this morning, the bottom of the long-term resistance zone the contract took out last week. Failure here suggests a test of the 54.80 level ahead of trend line support for the entire June to September rally at 53.65 this morning. Resistance is at 56.60 and 57.00 although both levels now look unlikely to be seen in the Asia session.
WTI spot has nearby support at 49.60 followed by a series of daily lows and the 200-day moving average at 49.25. A break of 49.25 implies a much deeper correction is on the cards to the 100-day moving average at 47.60. Resistance is at 50.50 initially followed by the 51.40 regions, a daily double top and the former trend line support that WTI broke on Monday.
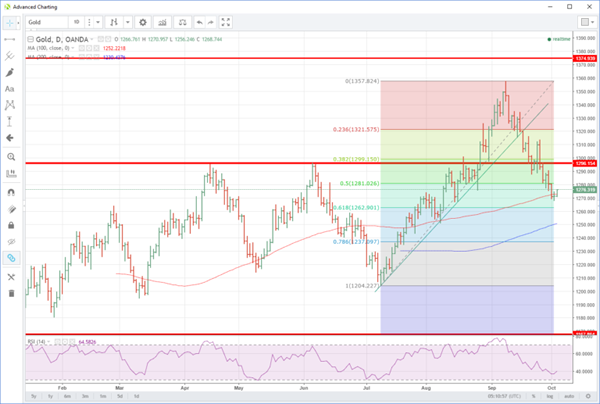
Gold
Gold ranged quietly overnight, climbing slightly to finish three dollars higher at 1275.00 as Asia trading gets underway. With China on holiday this week we would expect precious metals to be subdued in Asia. However, volatility should pick up in North America as we head into a data-heavy end of the week. The street appears to be on hold for just that given a general lack of volatility in markets overnight.
Gold has initial resistance at 1281.00 and then 1296.00 with the 100-day moving average, just below at 1272.00, serving as an intra-day pivot point. Below here, support appears at 1268.50 and then 1263.00 ahead of the 200-day moving average at 1251.00.