
The US dollar index has lost around 12% since October 2022 till its local low at the end of January 2023. One of the major reasons for the devaluation was the oil prices decline. Combined with the 4.50% Fed rate hike since the beginning of 2022 and the launch of QT, this led to a 2.7% inflation drop, pressuring the greenback.
However, in February, the US dollar index gained over 3%, and there are some significant reasons for that move.
This article will discuss the drivers for the US dollar’s further increase and look at the most popular trading instruments from the technical analysis side.
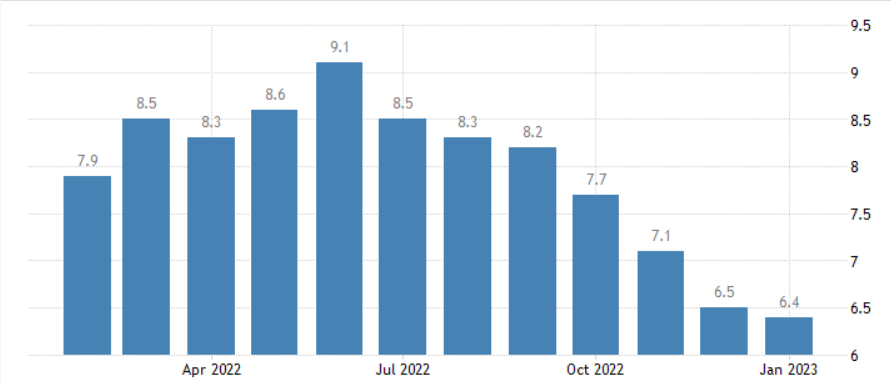
US Inflation m/m
Why the US Dollar Reversed?
On February 15, the Bureau of Labor Statistics published the CPI numbers for January 2023. The actual results overperformed expectations, with inflation rising 6.4% y/y versus the 6.2% y/y estimated.
The change in inflation has a time lag to the rate hike by the Fed, which slowed its pace in November and December, raising rates by 0.50% and 0.25%, respectively, after three consecutive 0.75% hikes.
Why is it so important? As soon as the Fed became less aggressive, inflation gave the first hints of an uptrend continuation, which sounds dangerous for the Fed and the US economy. The strong labor market added fuel to the fire. In January nonfarm sector added 517K jobs vs. 193K expected, and wedges gained 0.3% m/m. Moreover, Retail Sales increased by 3.0% in January vs. -1.1% in December, while the producer price index rose by 0.7% in January vs. -0.2 in December. All these factors prove that the US economy remains overheated, and prices might keep growing.
As a result, it looks like the Fed is failing in battle against inflation. That’s why most of the FOMC voting members in 2023 are hawks, who try to cool down the stock market and the US economy, which continues to grow.
If February’s report, expected in March, confirms that the prices continue to grow and the Fed has failed with its monetary policy, the markets might panic, and the US dollar will be the major beneficiary.
Another fact to pay attention to is an inversion of the US Treasuries yield curve.
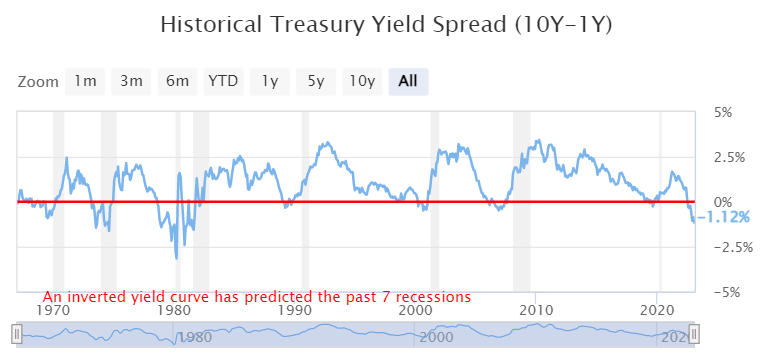
US Treasury Yield Spread (10Y – 1Y)
An inverted yield curve occurs when yields on short-term bonds rise above the results on longer-term bonds of the same credit quality, which has proven to be a relatively reliable indicator of an economic recession.
As you can see in the picture above, the gray bars throughout the charts indicate the past US recessions since 1967. A quick look at the “Historical Treasury Yield Spread (10Y-1Y)” graph suggests that, historically, an economic recession generally follows once the yield spread drops below 0% (the red Y-axis). This is especially true for recessions during the late 1900s. The yield spread reached an all-time low of -3.16% around April 1980, during the economic recession of the early 1980s.
As soon as the recession finally happens, the US dollar will gain heavily against other currencies as the major safe-haven asset.
Technical analysis
DXY, Weekly timeframe
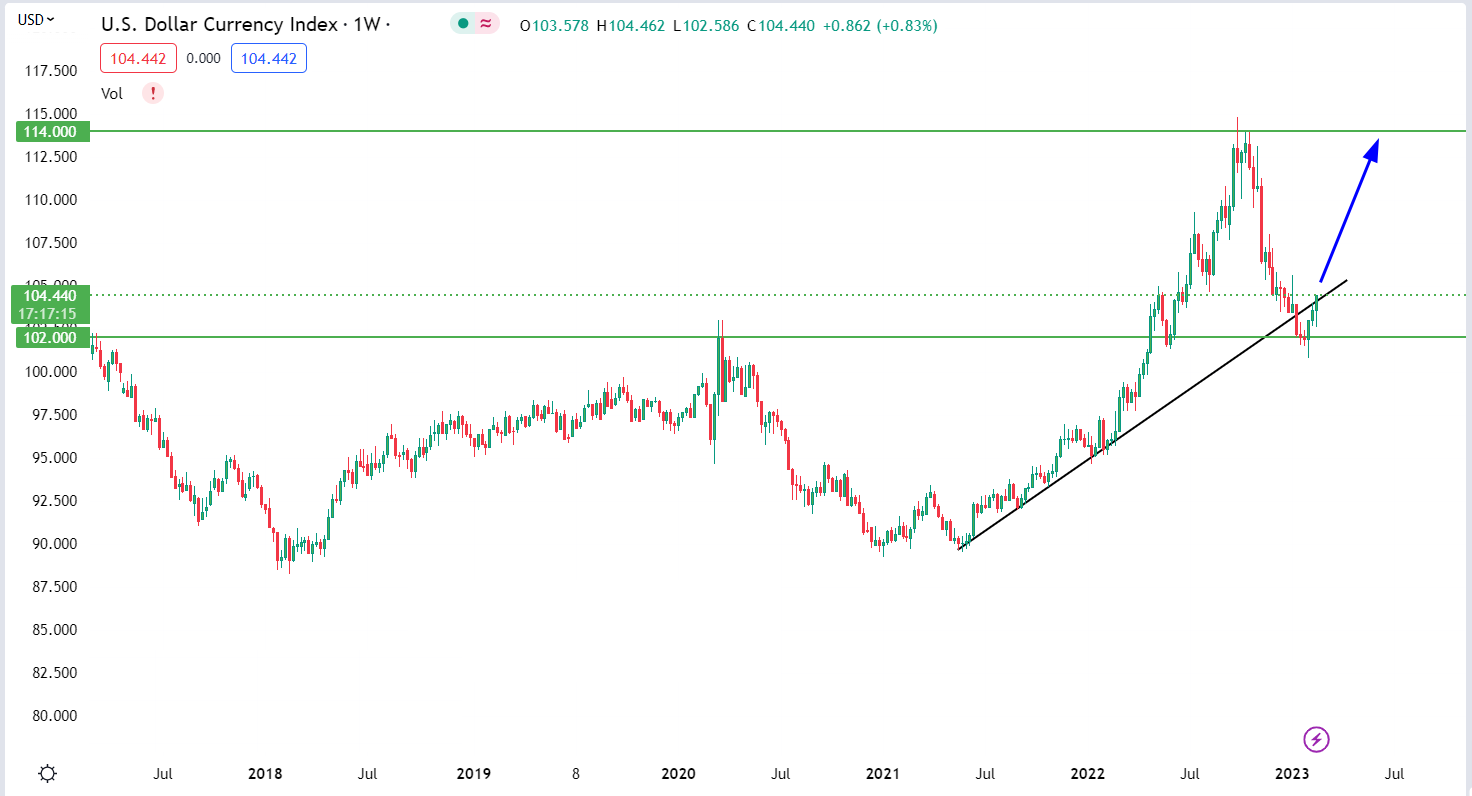
On the weekly timeframe, the US dollar index (DXY) broke above the ascending resistance trendline. Moreover, the price significantly reversed from the support level of 102.00, the 2008- and 2020-year highs. Thus, a combination of these factors confirms that the US dollar is still in a strong uptrend and that the recent decline is just a correction ahead of a massive rally.
The closest target for the US dollar is 114.00, a 9.5% gain. If the index breaks above this resistance, it will move to 120.00, gaining another 5%.
EURUSD, monthly timeframe
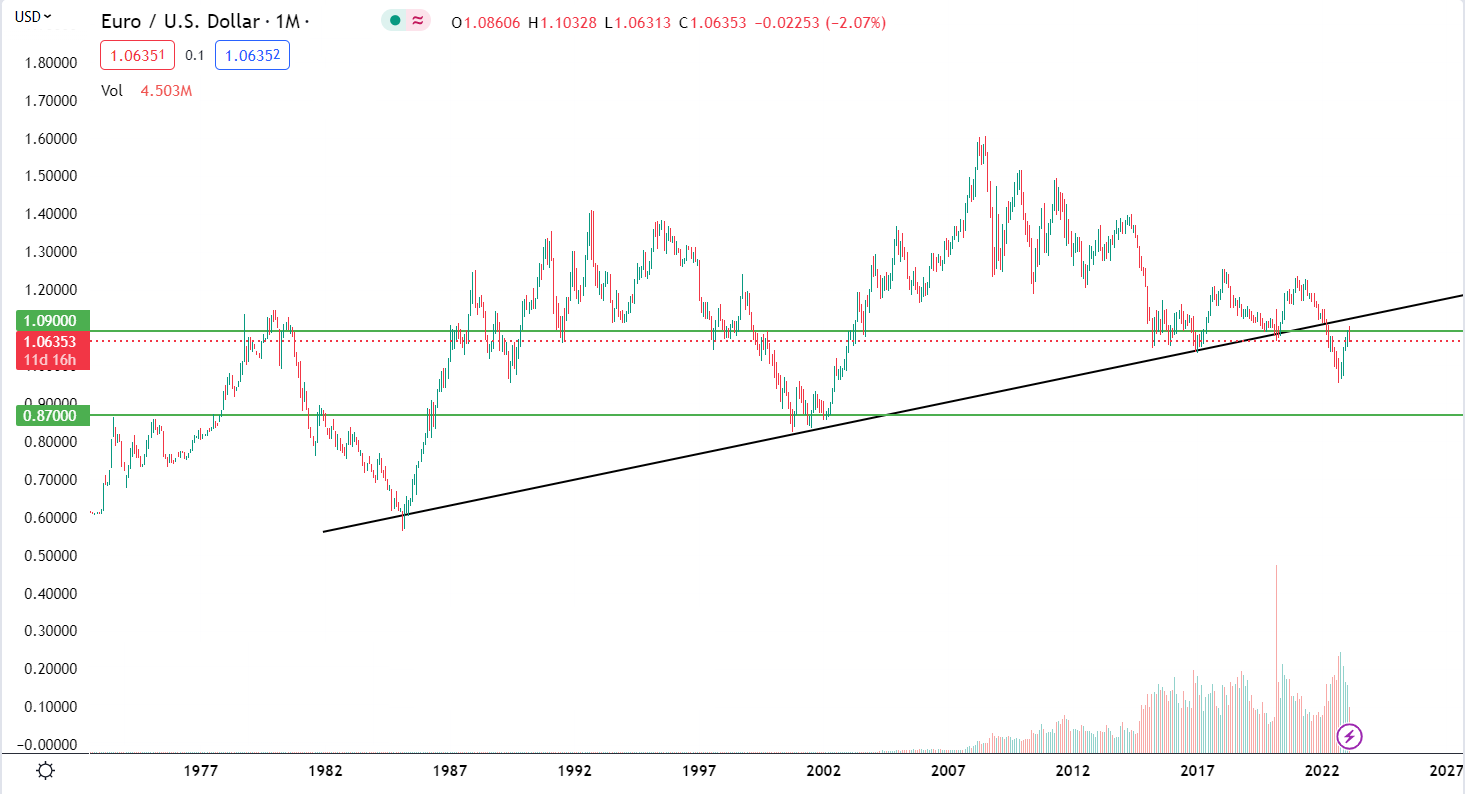
In 2022 the EURUSD broke through a global support trend line stated in March 1985. Recently, the price tested the breakout from below 1.1000 and bounced back. Also, it is noticeable that the pair has been moving in a strong downtrend since 2008. We expect this trend to continue with EURUSD heading toward the 2000s low at 0.8500.
XAUUSD, Weekly timeframe
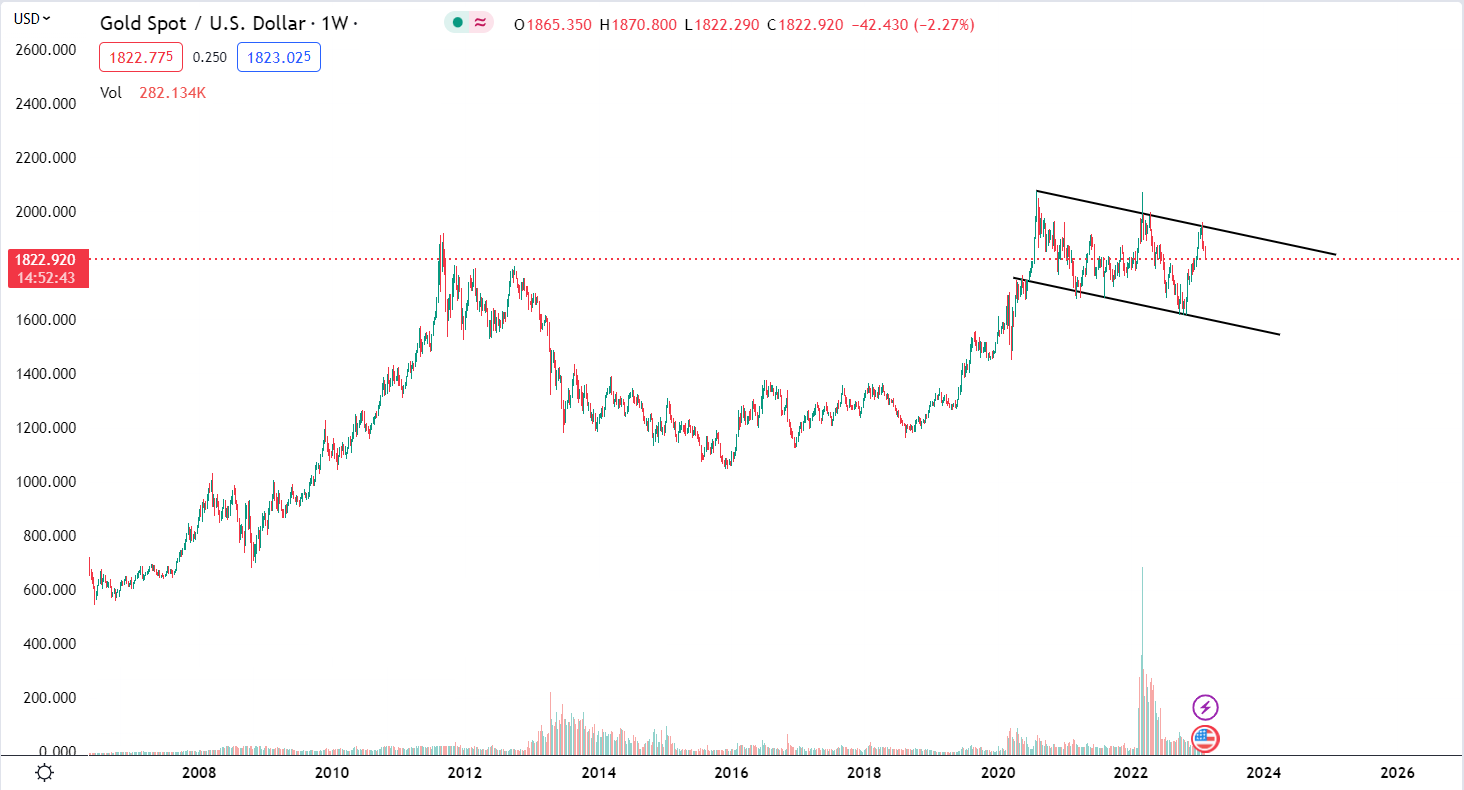
XAUUSD is forming a global “cup and handle” pattern. A breakout of the upper border of the handle will open the way to 2800.00 for the yellow metal. Fundamentally, it might be caused by a global financial crisis or geopolitical conflict.
However, in the short term, the price may decline to the lower border of the handle, which is around 1600.00.
Conclusion
Learning global trends is an essential thing for every trader. After observing macroeconomic numbers and technical analysis of high timeframes, we can conclude that the world is facing a recession. And the only question remains: When will it begin? Usually, the financial crisis begins when the US treasures yield curve returns above 0. Thus, feel free to use this indicator to predict global trends in the future.


