
- The year-to-date performance of the S&P 500 has been heavily skewed by the top 8 market cap stocks (FAANG + MNT).
- US regional bank fear persists despite the takeover of First Republic Bank by JPMorgan Chase.
- Markets are looking out for clues on the timing of the first Fed rate cut in today’s post-FOMC.
The combined top 8 US stocks (in terms of market capitalization) in the S&P 500 under the FAANG + MNT group; (Meta/Facebook, Apple, Amazon, Netflix, Alphabet/Google, Microsoft, NVIDIA, Tesla) that contributed close to 102% of the 2023 year-to-date return of the S&P 500 as of 28 April.
These observations suggest the average return of the remaining 492 stocks in the S&P 500 is negative which indicates a weak market breadth condition.
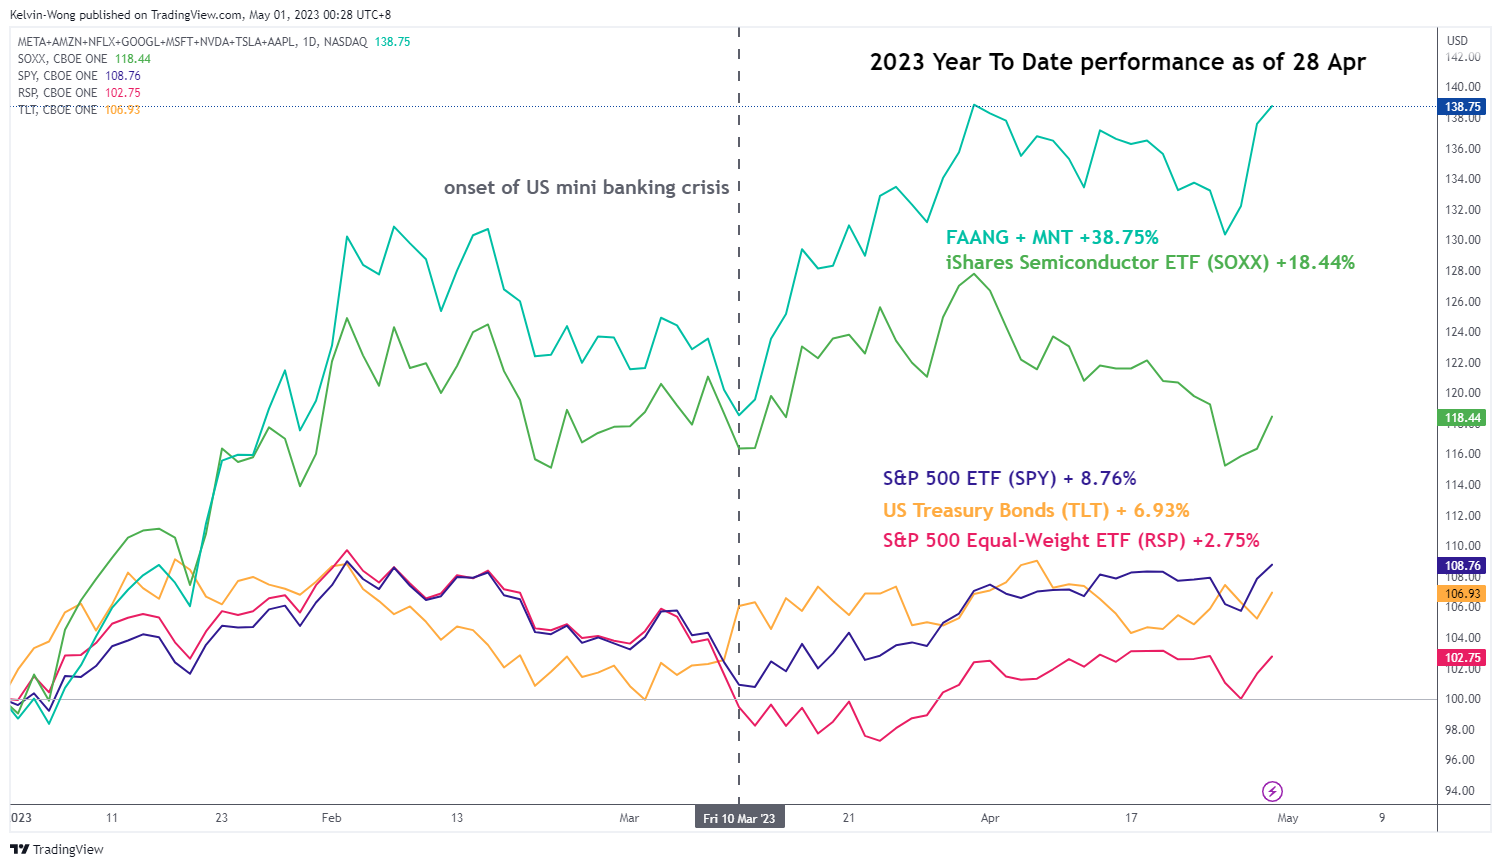
Fig 1: Year-to-date performance of FAANG +MNT & key US stock indices as of 28 Apr 2023 (Source: TradingView , click to enlarge chart)
2023 YTD Performance as of 28 Apr
- FAANG + MNT (equal weight) = +38.75%
- FAANG + MNT (respective market cap weight in S&P 500) = +8.93%
- S&P 500 ETF (SPY) = +8.76%
- S&P 500 Equal Weight ETF (RSP) = +2.75%
- iShares US Semiconductor ETF (SOXX) = +18.44%
- US Treasury Bonds ETF (TLT) = +6.93%
The lopsided return from FAANG + MNT became more pronounced after the onset of the US mini-banking crisis in mid-March.
The main narrative that supports this long-duration risky asset play is an imminent Fed pivot to start a fresh interest rate cut cycle in July or September 2023 to alleviate the balance sheet stress of the regional banks from the assets side (mark-to-market losses of Treasury bonds, commercial real estate loans) as well as negate the flight of deposits flows (liabilities side) to higher-interest yielding money market funds where it has triggered a self-reinforcing fear feedback loop of a bank run.
Also, if a fresh interest rate cut cycle is being brought forward to the second half of 2023, it can kickstart a faster revival of loosening financial conditions to boost the earnings potential and demand (via potential share buybacks) of the FAANG + MNT group.
Guidance from the Fed so far has been reluctant to kickstart an interest rate cut cycle in 2023 due to the fear of elevated sticky inflation and entrenched inflationary expectations from consumers and businesses.
The evidence of sticky inflation and stagflation risk in the US can be seen in the latest ISM Manufacturing PMI report for April. The ISM Prices Index subcomponent that tracks prices of raw materials paid by manufacturers has increased to 53.2% from 49.2% in March, reversing its prior decreasing rate of change.
There is still fear in the US banking system
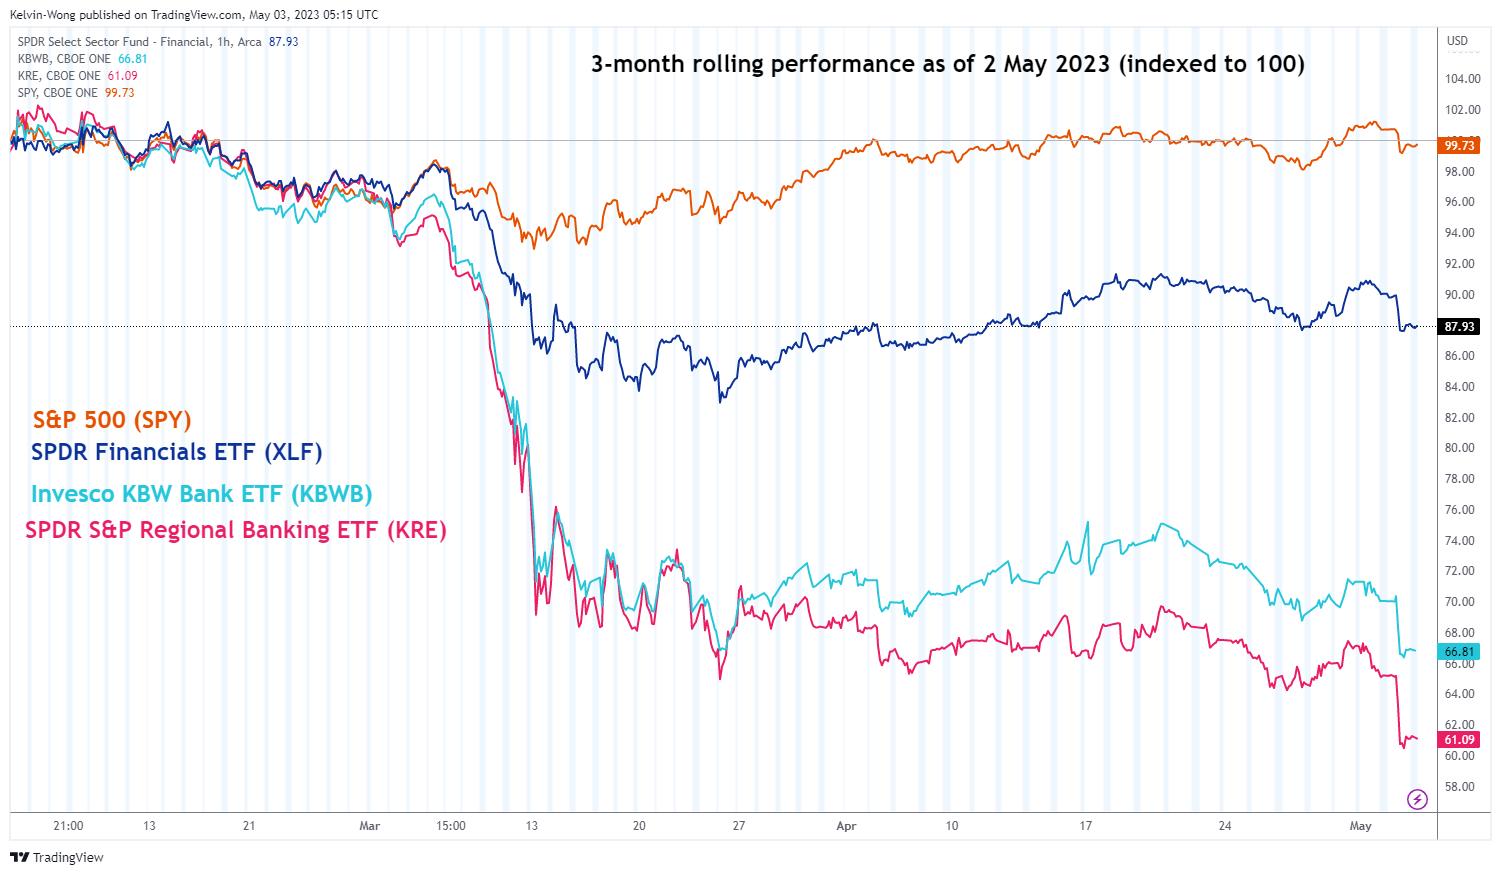
Fig 2: 3-month rolling performance of US banks ETFs as of 2 May 2023 (Source: TradingView , click to enlarge chart)
Despite the takeover of the embattled regional First Republic Bank by JPMorgan Chase in a US government-led deal on late Sunday to fill a hole in the troubled lender’s balance sheet, the share prices of other US regional banks have continued to plunge since the start of this trading week.
The share price of the SPDR S&P Regional Banking ETF (KRE) has dropped by -9% since Monday, 1 May, and -38% on a 3-month rolling basis which implies that market participants are not assured by the latest rescue efforts on First Republic Bank and the balance sheet stress as mentioned earlier on the other US regional banks persist.
Perhaps, the continuation of the plunge seen in the share prices of regional banks by negative animal spirits is issuing a challenge to the Fed to abandon its inflationary targeting regime for now and pivot towards an interest rate cycle as soon as possible to stamp out deflationary growth concerns triggered a credit crunch and heightened systemic risk
Will the Fed throw in the towel to abandon inflation targeting?
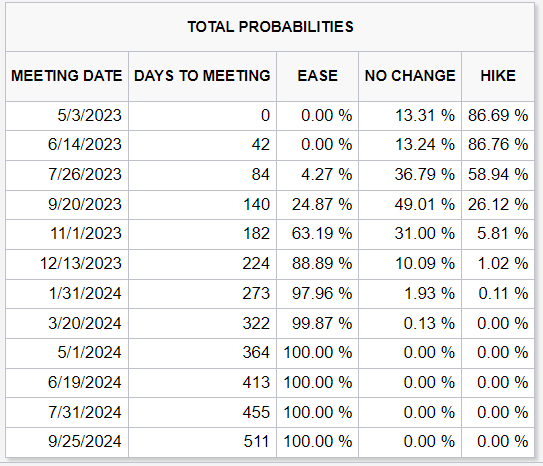
Fig 2: Probability of future Fed funds rate hike or cut implied by 30-day Fed Funds futures data as of 2 May 2023
(Source: CME FedWatch tool, click to enlarge chart)
The market has almost fully priced in a further interest rate hike of 25 basis points to bring the Fed funds rate to 5.00%-5.25% and that should be the terminal rate, the last hike in the current tightening cycle based on the CME FedWatch Tool derived from the pricing of the 30-day Fed Funds futures data.
The golden question now is, will the Fed hold the Fed funds rate at this level for a longer period or will there be a first-rate cut coming in July or September this year?
Today’s Federal Open Market Committee (FOMC) monetary policy decision outcome does not come with an updated “dot-plot” where Fed officials submit their latest forecasts for the level of the Fed funds rate from 2023 to 2025.
Hence, the accompanying monetary policy statement and Fed Chair Powell’s post-FOMC press conference may offer clues and clarity on the signal and guidance to determine the willingness of the Fed to switch gears to a more accommodative stance.
If we take a leaf from a past statement issued on the 21 March 2007 FOMC meeting; “future policy adjustments will depend on the evolution of the outlook for both inflation and economic growth, as implied by incoming information.”– that will be an example of the Fed that is prepping for a fresh interest rate cut cycle.
US SPX 500 Technical Analysis – Trapped below 4,215 key range resistance
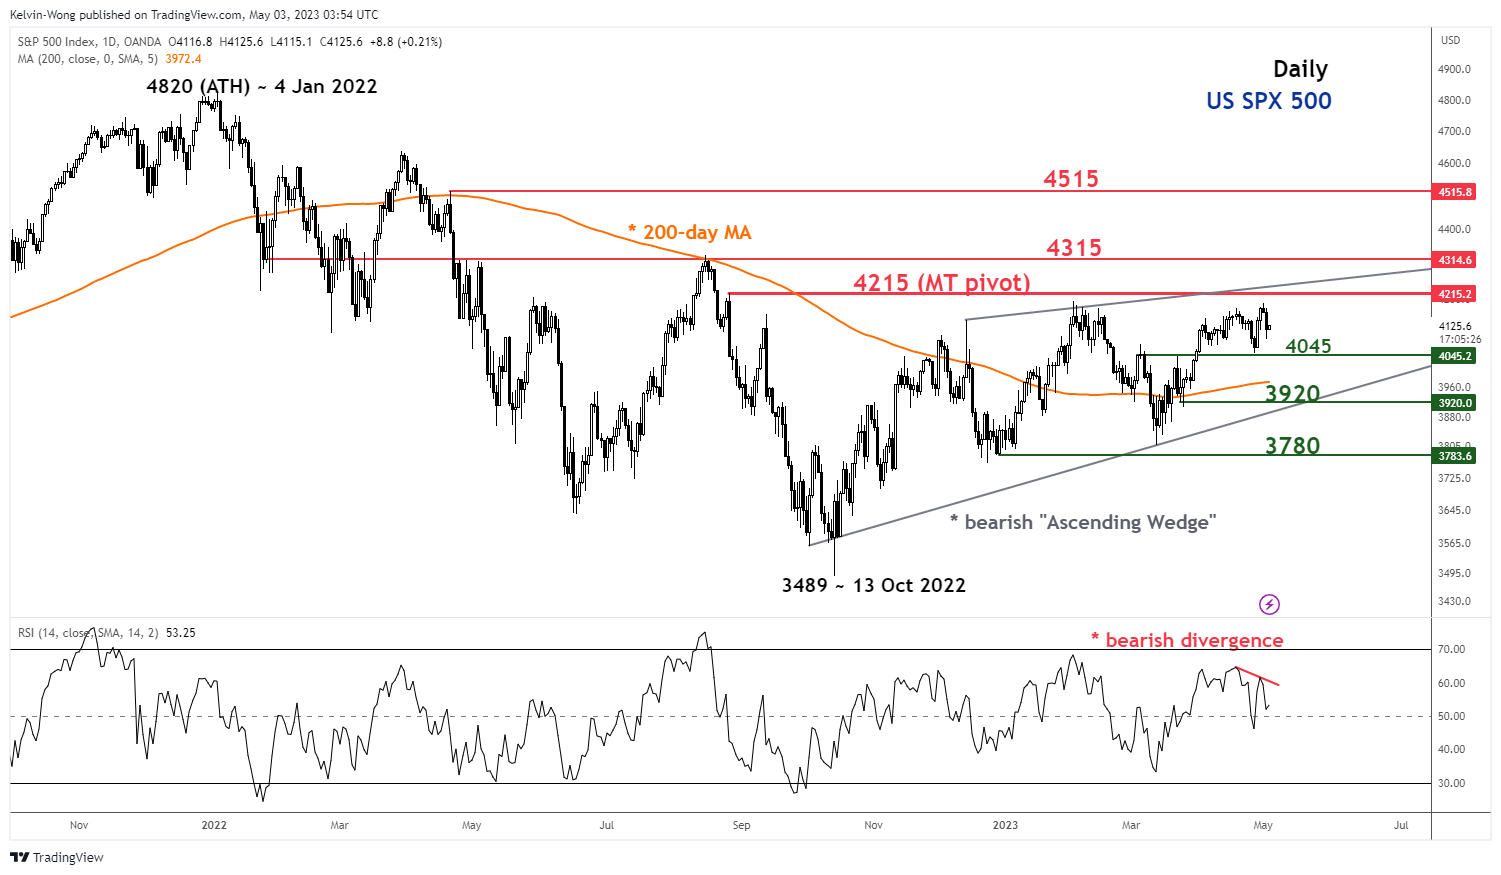
Fig 3: US SPX 500 trend as of 3 May 2023 (Source: TradingView, click to enlarge chart)
Since its minor up move of 10% from its 13 May 2023 low of 3,806 to its recent high of 4,189 printed on 1 May 2021, the US SPX 500 Index (a proxy for the S&P 500 futures) has failed to make any breakthrough above the 4,215 key medium0-term pivotal range resistance for the 3rd time; previous attempts were on 2 February 2023 and 13 December 2022.
In addition, medium-term upside momentum has turned lackluster as indicated by the recent bearish divergence observation seen on the daily RSI oscillator with the price actions of the Index that has continued to evolve into an impending potential bearish reversal “Ascending Wedge” configuration in place since the 3,489 medium-term swing low of 13 October 2022.
A break below 4,045 immediate support may expose the next support at 3,920 in the first step. On the other hand, a clearance with a daily close above 4,215 negates the bearish tone to see the next resistance coming in at 4,315.


 in the S&P 500 under the FAANG + MNT group; (Meta/Facebook, Apple, Amazon, Netflix, Alphabet/Google, Microsoft, NVIDIA, Tesla) that contributed close to 102% of the 2023 year-to-date return of the S&P 500 as of 28 April.)