
The US Dollar has just concluded one of its toughest years in recent memory, correcting approximately 10% from its early 2025 highs of 110.00.
Yet, even after a rough final month of trading, the Greenback is beginning to flash signs of a potential rebound.
The implications of this shift are significant. A new year often marks the genesis of new market trends as traders and asset managers reassess their allocations. In Currency Markets, the dominant narrative for 2026 will hinge on whether the US Dollar continues to suffer outflows or if that theme died with 2025.
With the Euro and Swiss Franc finishing the year on top, the question remains: is there more upside left in the tank?
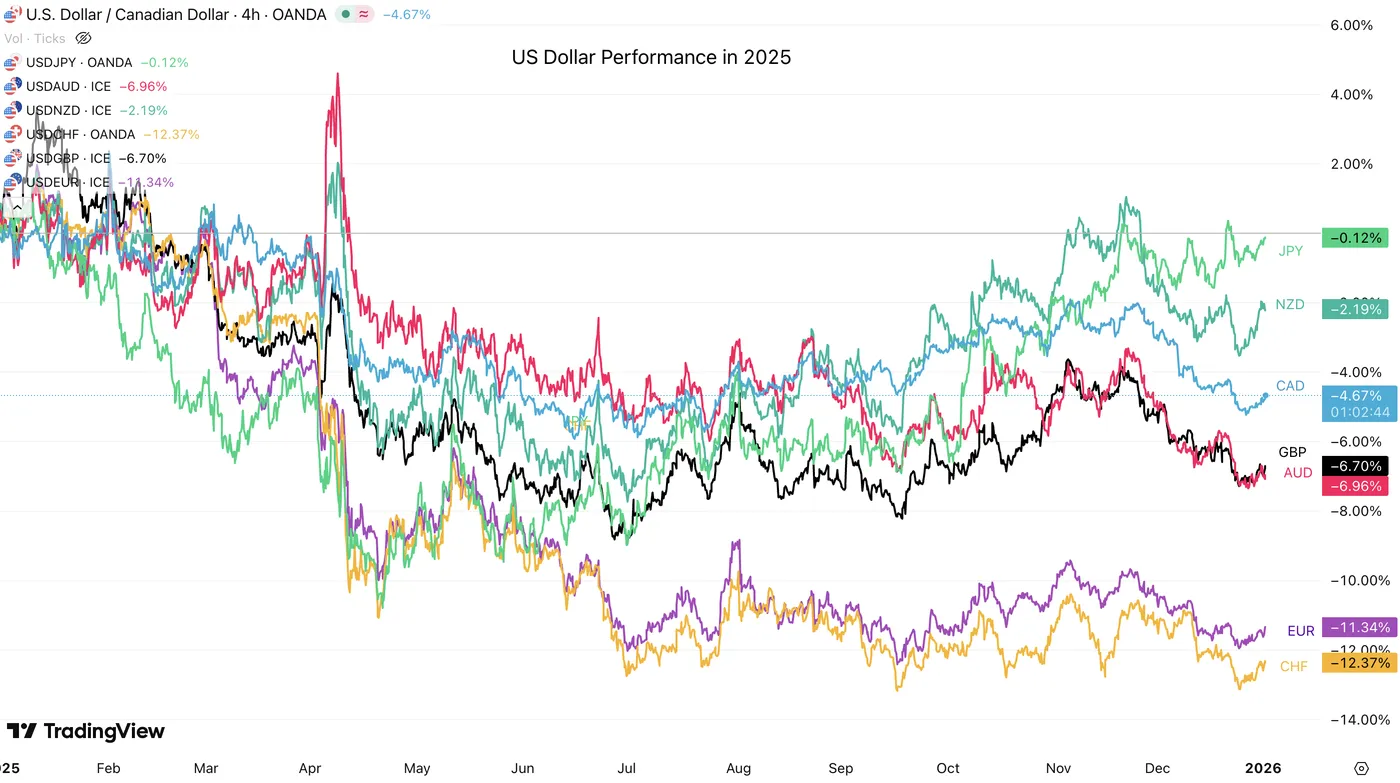
Performance of other currencies against the US Dollar in 2025 – Source: TradingView
Much of this will depend on whether regional growth can be sustained. Continued defense spending within the EU area is expected to act as a broad positive for the Euro. However, the USD still holds several trump cards:
- Feasibility of Diversification: Investors seeking fixed-income alternatives that rival the depth and liquidity of US Treasuries may find their options limited, naturally steering flows back to the dollar.
- Cash Positioning: With fund managers’ cash levels at historic lows, a mean-reversion toward safety amid elevated equity valuations could provide a structural uplift for the USD.
- Legal & Economic Catalysts: If the US economy remains resilient, or if controversial tariffs are struck down by the Supreme Court, asset managers caught offside could be forced to cover, sparking a rally.
On the flip side, risks remain skewed to the downside if economic weakness accelerates, if the Fed’s independence is compromised by a new Chair appointment in May 2026, or if further instability from the Trump Administration triggers a fresh wave of global outflows.
Let’s dive right into a few Dollar Index (DXY) charts to see what the trading candles could foreshadow for the Greenback.
Dollar Index Technical Outlook
Daily Chart
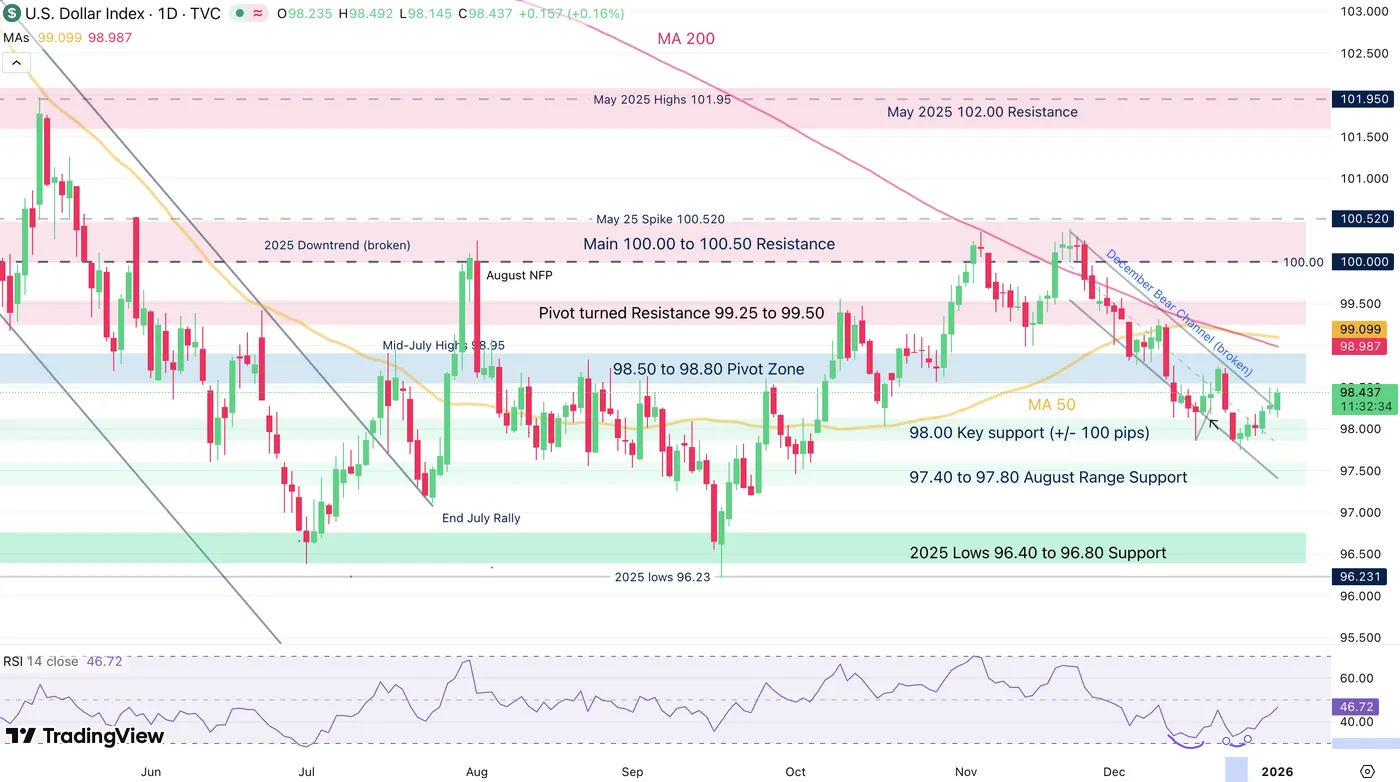
Dollar Index (DXY) Daily Chart. January 2, 2025 – Source: TradingView
The US Dollar just broke out of its descending channel formed since the end of November.
Weakened by a reinstalled outflows ahead and after the cut, sellers took back the action after the DXY reached the 100.00 Level.
Now rebounding from the 98.00 handle, buyers could be making a reappearance in order to retake the advantage after a RSI double-bottom.
Let’s take a closer look.
4H Chart and Trading Levels
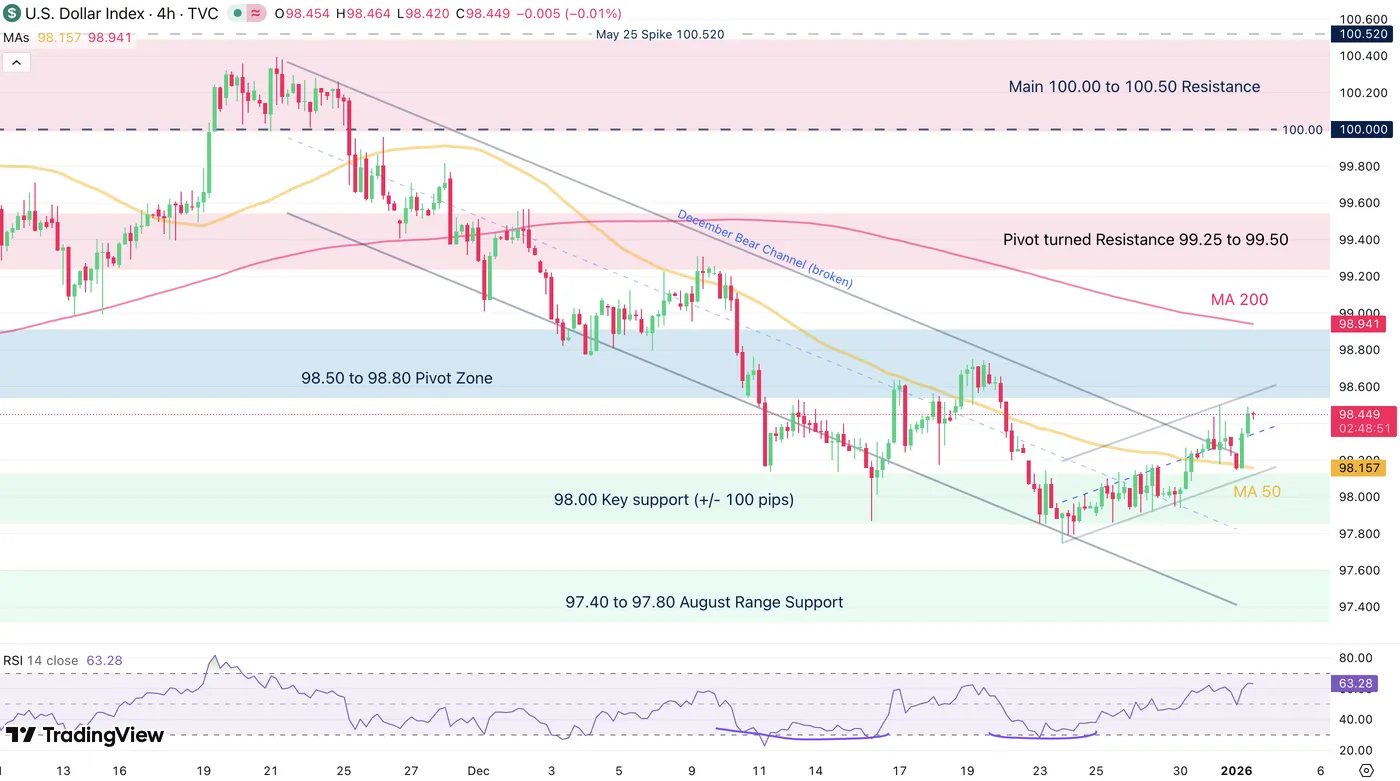
Dollar Index (DXY) 4H Chart. January 2, 2025 – Source: TradingView
Now bouncing from its intraday moving average, the USD is elevating towards the 98.50 to 98.80 Pivot Area. Watch if buyers manage to push above the 98.50 session highs.
Bouncing back above would generate a high probability setup of a test of the 100.00 level, implying down performance of other FX Currency Majors.
Levels to place on your DXY charts:
Resistance Levels
- 98.50 to 98.80 Pivot Zone (immediate test)
- 98.58 (200-Hour Moving Average)
- Pivot turned Resistance 99.25 to 99.50
- 100.00 to 100.50 Main resistance zone
- 100.376 November highs
Support Levels
- 98.00 Key support (+/- 100 pips) – Recent rebound
- 97.75 Recent lows
- 97.40 to 97.80 August Range Support
- Mini-support 98.50
- 2025 Lows 96.40 to 96.80 Support
- Safe Trades and Happy New Years!