
Ever since correcting from its 100.00 peak in mid-November, the US Dollar has been locked in a volatile, multi-directional chop.
After a rough ride throughout 2025—particularly the first half—the Greenback has struggled to find conviction in either direction.
A 10% correction in the world’s primary reserve currency was never likely to be a straight line to new decade lows.
While dedollarization was the prominent narrative of last year, reality is setting in.
With the US economy still outperforming its peers, American firms dominating global equities, and the Fed remaining persistently reluctant to cut rates, participants are realizing that divorcing the Greenback is easier said than done.
As we suggested around mid-October, the sharp correction from 110.00 to 97.00 on the Dollar Index was indeed followed by a period of consolidation, with price action settling closer to the current 98.00 to 100.00 range.
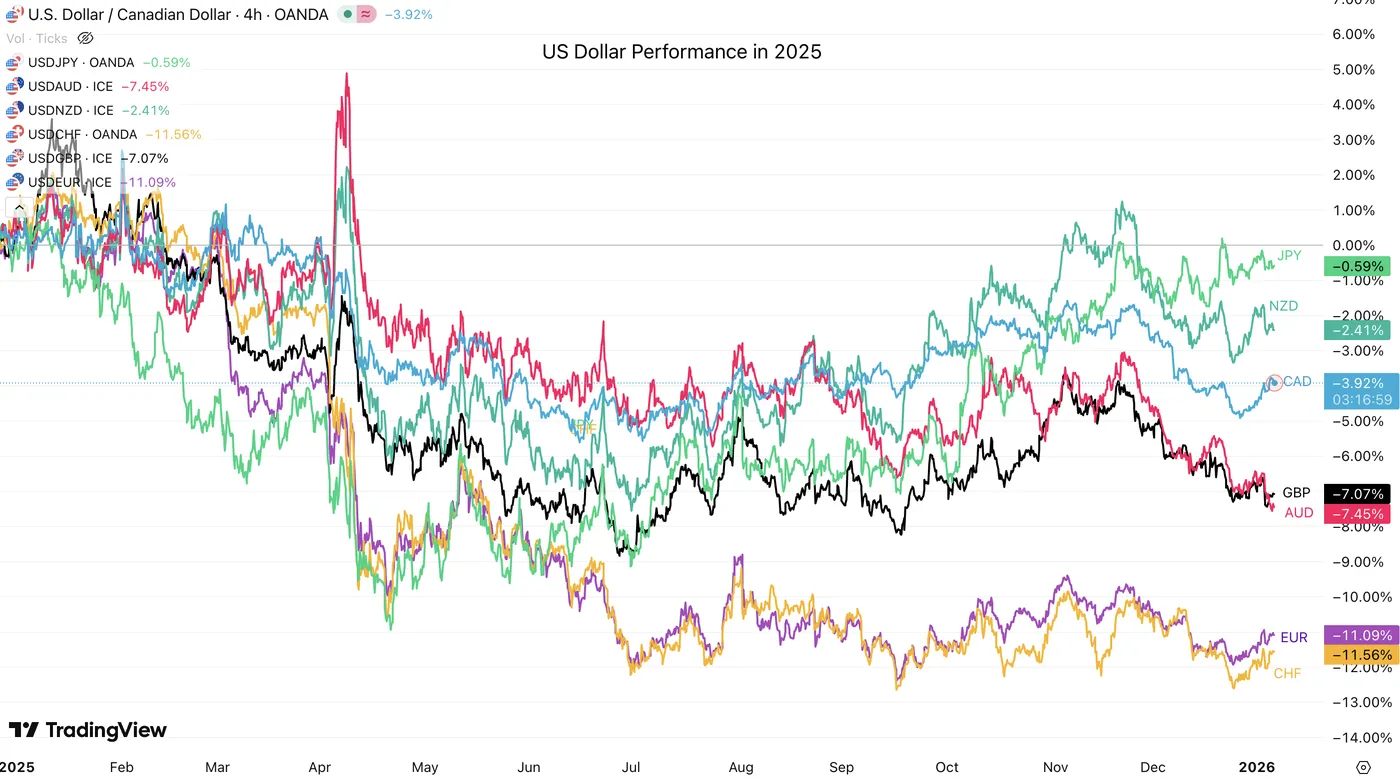
US Dollar Performance against other FX Majors in 2025 – Source: TradingView
Following the capture of Maduro and this week’s explosive market open, the USD initially gave up some of its late-December rebound as global assets, particularly Stocks went ballistic.
However, a quintessential theme for FX and global trading appears to be developing: the return of “US Freedom” could trigger a fresh wave of demand for the reserve currency.
Between economic resilience and the projection of military strength to protect political interests, the US reasserting itself on the global stage is being perceived positively by traders.
We will now dive into a multi-timeframe analysis of the US Dollar Index (DXY) to decipher what the price action is hinting at and what we can expect in 2026.
Dollar Index (DXY) Multi-Timeframe Analysis
Daily Chart
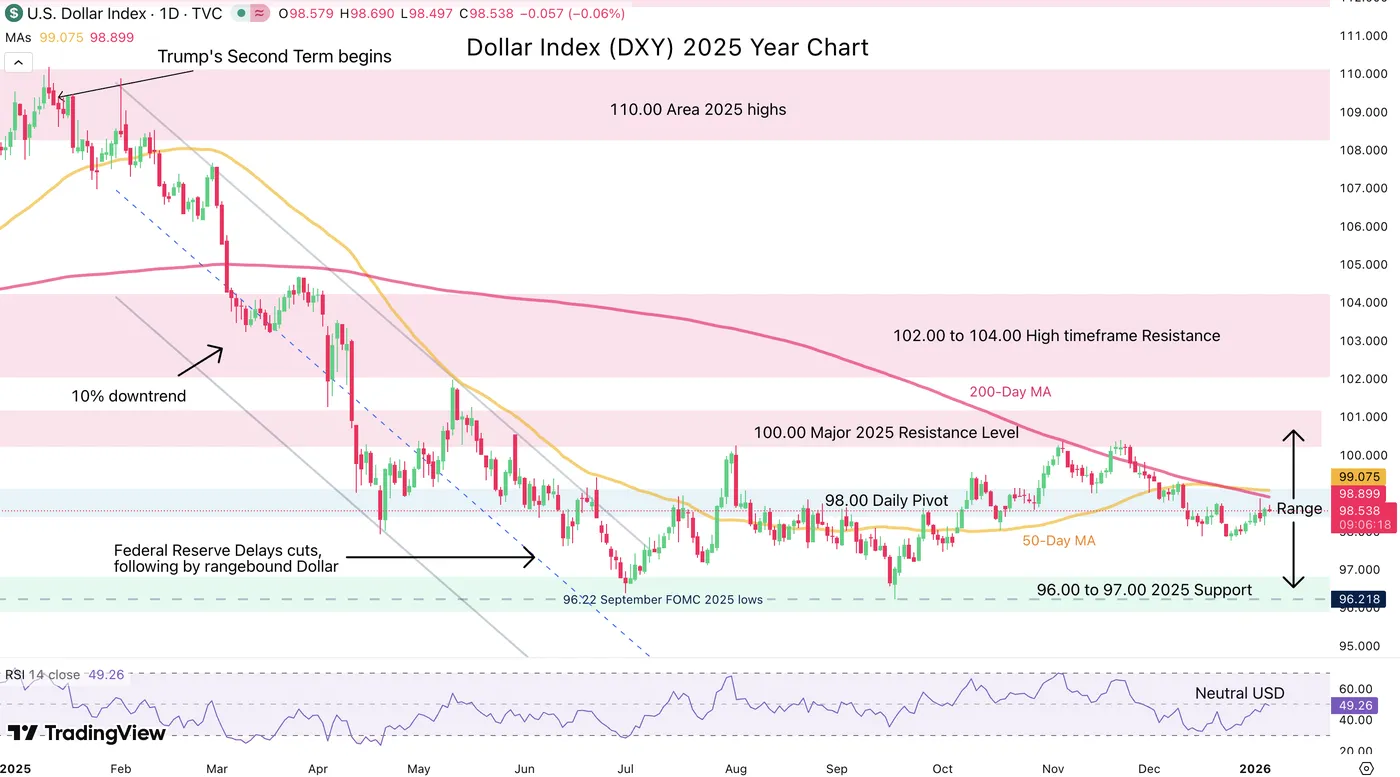
DXY Daily Chart. January 7, 2026 – Source: TradingView
The US Dollar has held its 97.00 to 100.00 range almost to the T.
What was perceived as surprising strength throughout October, as the Dollar was strengthening during the shutdown, was just mean-reversion move from a support bounce.
So what about now? The latest daily correction phase between 100.40 (Nov Highs) to the ~98.00 Handle marks a continued backlog to dollar demand.
The idea here is that with Dollar sellers failing to push the Index to its Range lows (96.00 to 97.00 Support Zone), some underlying strength is assisting the Dollar, hinting at higher chance of an upside breakout.
Still, some factors could imminently influence the Dollar so keep an eye on reactions to:
- Further menaces to other countries: An Iran intervention would be bullish for the USD while invading Greenland could lead to a major selloff.
- The Supreme Court rejecting tariffs would be a positive for the USD but may be a non-event if the Trump Administration continues
- If the Labor picture suddenly degrades and/or inflation confirms to be soft, more downside can largely be expected. More on this on Friday morning (8:30 – NFP report)
4H Chart and Technical Levels
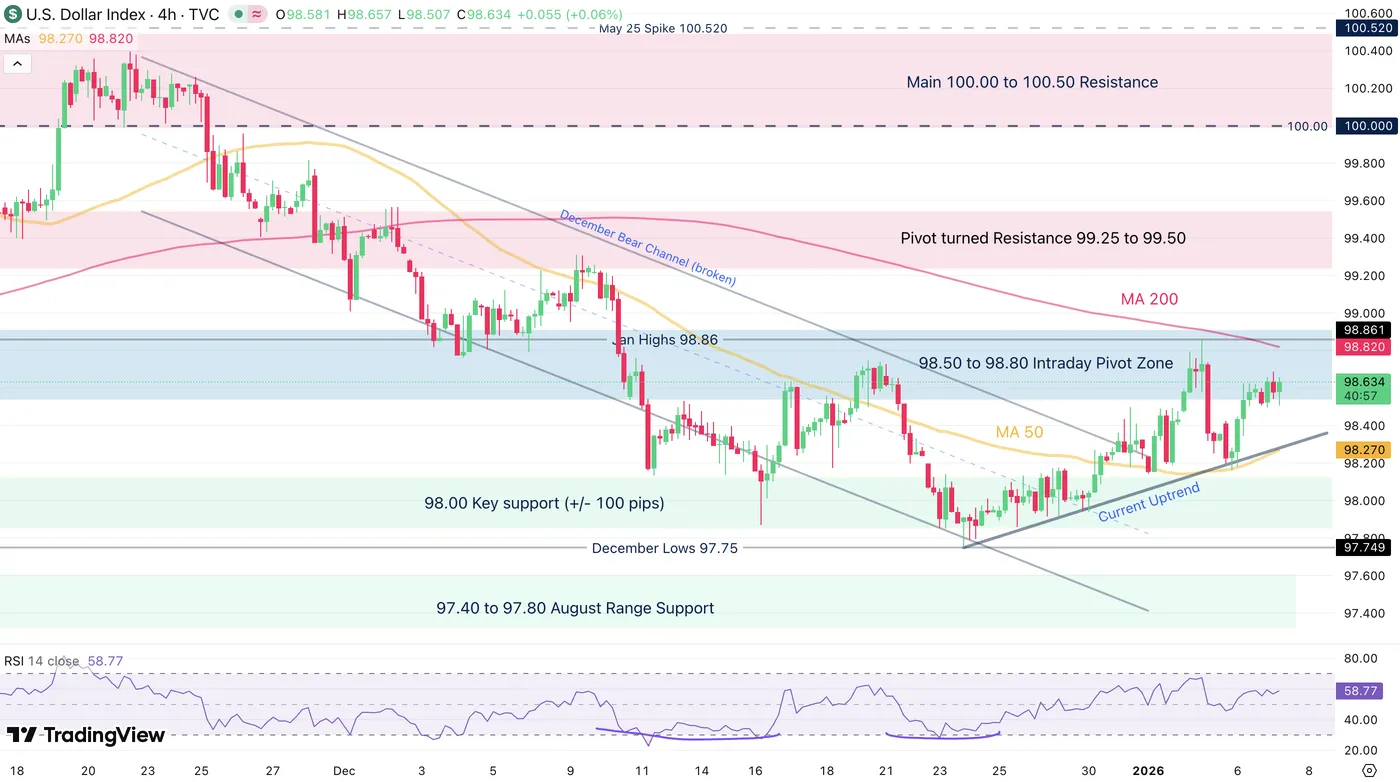
DXY 4H Chart. January 7, 2026 – Source: TradingView
Looking closer to the intraday timeframe, bulls are grabbing the advantage by holding strong demand at the upward trendline.
Having broken the downward channel, higher action could make further sense.
Still, failing to breach Monday highs at 98.85 should lead to rangebound action
Levels to place on your DXY charts:
Resistance Levels
- 98.50 to 98.80 Intraday Pivot Zone
- 98.82 (200-4H Moving Average)
- Pivot turned Resistance 99.25 to 99.50
- 100.00 to 100.50 Main resistance zone
- 100.376 November highs
Support Levels
- 98.00 Key support (+/- 100 pips) – Recent rebound
- December Lows 97.75
- 97.40 to 97.80 August Range Support
- Mini-support 98.50
- 2025 Lows 96.40 to 96.80 Support
1H Chart
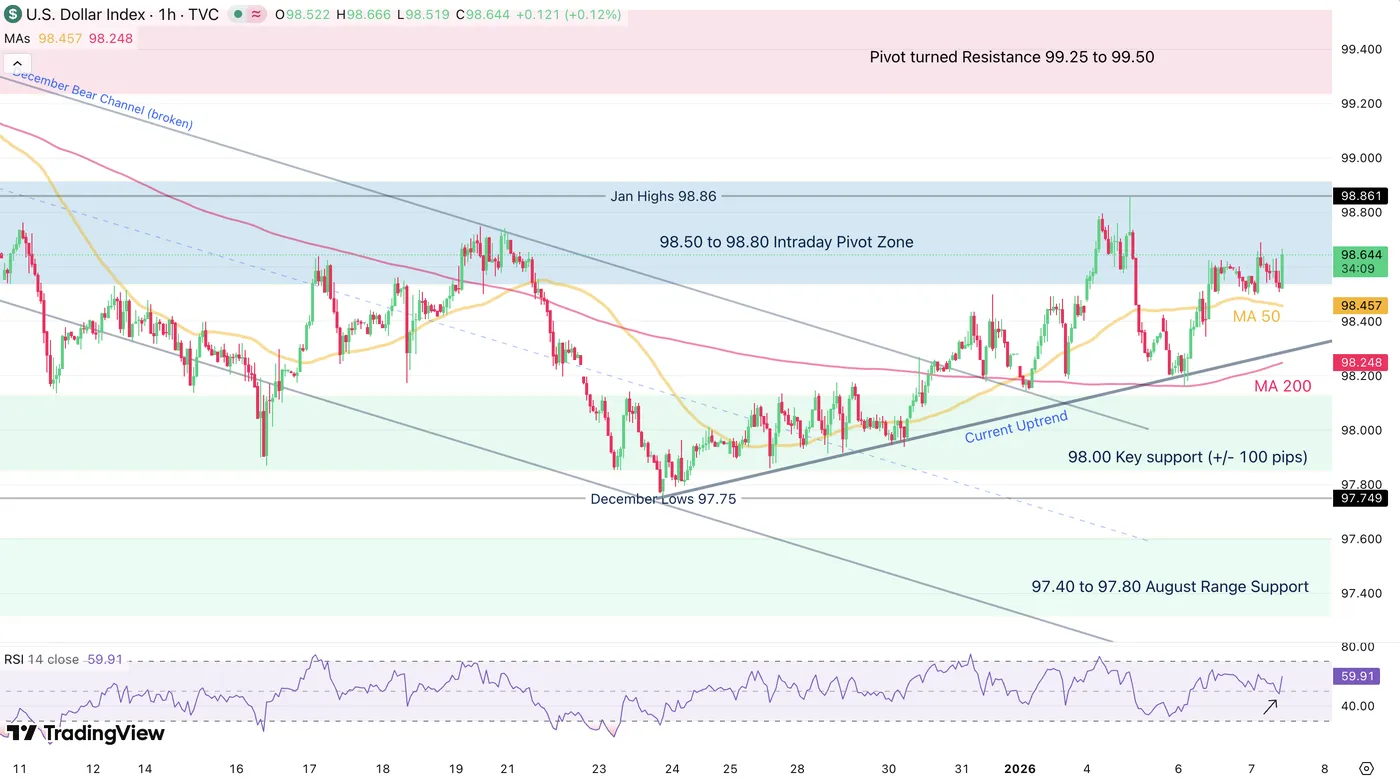
DXY 1H Chart. January 7, 2026 – Source: TradingView
The 1H Timeframe confirms the bullish action as buyers have breached both the 50 and 200-Hour Moving Averages, now acting as support.
Breaking the Monday highs at 98.85 would then not see much resistance until 99.30 to 99.50 – In this scenario, look for USD selling FX positions.
On the other hand, rejecting the Monday highs could trigger nice rangebound conditions in EUR/USD or USD/JPY. As bulls are leading an ongoing buying attempt, keep a close eye to the reactions.
Safe Trades and Happy New Year!