
Highlights
- President Trump last week imposed tariffs on imported steel and aluminum, largely in accordance with the findings of two Commerce Department reports. The tariffs will be initially set at 25% for steel and 10% for aluminum, with the goal of increasing and maintaining domestic industry’s capacity utilization around 80%.
- Canada and Mexico have been excluded from the tariffs, but the continued carve-out is conditional on the successful renegotiation of NAFTA. Other countries will also be able to apply for exemptions from the tariffs. As further exemptions are added, the rate on the tariffs will likely rise.
- Imposing the proposed tariffs will lead to a sharp increase in U.S. steel and aluminum prices which will pass-through and lift CPI inflation by about 0.1pp. The tariffs will also result in lower imports — helping narrow the U.S. trade deficit. Domestic production will compensate, increasing by over 10%, and adding some 5,000 to 10,000 jobs as a result. However, the higher prices will hurt metal-intensive manufacturers in the U.S. including fabricated metals, machinery, and transport equipment, where 25,000 to 50,000 jobs could be lost vis-a-vis business-as-usual levels.
- In the case of Canada, assuming the exemption holds should lead to a modest upside for the Canadian steel and aluminum making industry, with output expected to rise by more than 10%, as some 1,500 new jobs are created. Still, the additional demand isn’t likely to lead to a surge in investment, particularly amidst existing uncertainty. A loss of the exemption should be unequivocally bad for the economy.
- The current situation remains fluid as countries are weighing their chances of exemptions and in some cases readying possible retaliatory measures. While we cannot rule out a trade war, such a scenario remains quite unlikely at this point in time, with retaliatory responses expected to be measured, as cooler heads prevail.
Chart 1: Trump Tariffs Target 80% CAPU
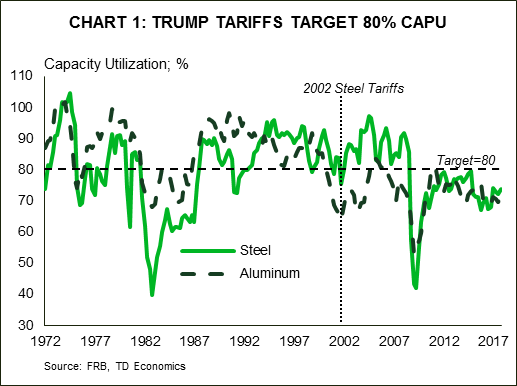 At the stroke of a pen on March 8th 2018, President Trump imposed tariffs on imported steel and aluminum, marking another significant step toward “America First” protectionism. The Presidential Proclamation largely follows the recommendations from two Commerce Department reports carried out under Section 232 of the Trade Expansion Act of 1962. These reportsi, presented to the President on January 11th and made public on February 16th, found that the present quantities and circumstances of steel and aluminum imports are “weakening our internal economy” and “threaten to impair the national security.” As a result, Commerce Secretary Ross recommended the President take immediate action, setting quotas or tariffs sufficient enough to enable domestic producers to operate at a capacity of at least 80% (Chart 1), even after any exceptions should they be granted. According to the reports, raising utilization rates from their current levels would require steel and aluminum imports to decline by 37% and 13% – achieved by setting blanket tariffs of 24% and 7.7%, respectively.
The President decided to impose a tariff of 25% on steel and 10% on aluminum, with the modestly higher rates offsetting the carve-outs for America’s NAFTA partners. Importantly, the exemptions for Canada and Mexico are conditional on a successful renegotiation of NAFTA, and will likely be used as bargaining chips. The Proclamation document itself embeds significant flexibility, enabling the President to implement further carve-outs and raise rates commensurately in order to keep imports and domestic capacity utilization at the desired level. At the extreme, exempting all but the 12 lowest cost exporters outlined in the report – including Brazil, South Korea, Russia, China, etc.ii – requires the tariff rate on steel be more than doubled to 53%. The same goes for aluminum, with a tariff of 23.6% necessary should it be levied only on the five countries highlighted in the report – China, Hong Kong, Russia, Venezuela, and Vietnamiii – as having significant overcapacity, lacking reliability, or engaging in transshipments from China to evade existing anti-dumping and countervailing duties. China, Russia and Vietnam were the only countries of the fourteen highlighted by the reports found on both lists, but the President’s veiled threat that the bilateral trade deficit will be cut “one way or another” was squarely targeted at China.
Chart 2: Aircraft, Soybeans, Autos, and Electronics At Risk of Retaliation
 While some countries, like Australia and the EU, are sure to apply for exemptions, the key offenders noted in the administration’s report may instead pursue retaliatory measures, even if only symbolic. Farm products appear to be the most likely choice for China due to their sheer volume and outsized political influence of farm states. Retaliatory measures could range from the relatively lenient, focusing on sorghum (KS, TX, AR, and NE), to the highly-punitive levied on soybeans (IL, IN, IA, MN, and NE). Already, China has pre-emptively tightened impurity limits on soybean shipmentsiv and launched an investigation into U.S. sorghum exportsv as warning shots. Aerospace and automotive industries are also at risk from China’s potential retaliation (Chart 2). On the other hand, countries that lack the scale, such as Vietnam or Venezuela, will likely focus even more on political pain points, with bourbon (KY, home state of Senate Majority Leader Mitch McConnell), cranberries (WI; home state of House Speaker of the House Paul Ryan), orange juice (FL), and peanut butter (GA). Iconic American brands selling motorcycles and jeans are also at a high risk. Lastly, steel and aluminum itself are themselves obvious choices.
In this report, we assess potential economic consequences of this trade action on the U.S. and Canadian economies. The situation remains very fluid, with the uncertainty likely to affect financial conditions and weigh on investment, but it is not yet clear how it will transpire. As such, we consider three potential scenarios:
- Exemptions expanded (potentially as broadly as to all countries apart for those highlighted in Commerce reports), retaliatory tariffs limited.
- NAFTA renegotiation unsuccessful, leading to implementation of tariffs on Canada and Mexico.
- Tariffs lead to consecutive rounds of retaliatory actions of increasing severity, ultimately manifesting in an all-out trade war.
Why the actions?
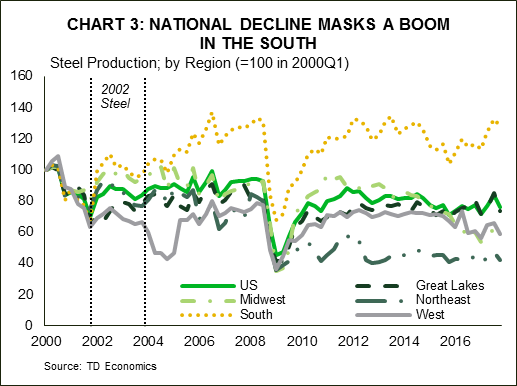
Chart 3: National Decline Masks a Boom In the South
 The actions undertaken by the Trump administration on steel and aluminum build on other efforts intended to level the global playing field for export-exposed industries in the hopes of supporting, and potentially reviving, the U.S. manufacturing sector. In addition to the economic reasons, steel and aluminum industries are considered strategic, with their continued decline raising national security concerns:
- U.S. steel production today only satisfies 76% of overall national consumption, and has fallen by 20% since the early-2000s when it accounted for around 90%. Employment has declined even more sharply, down 40% since then. These trends mask hide a significant shift in production and employment towards Southern states where production is up 28% since early-2000 (see Chart 3).
- As U.S. steel production capacity has been mothballed, any additional demand was satiated with imports, which tripled since early-2000s. To cope, U.S. supply chains have shifted primarily to Russia, Korea, and, until 2008, China. Given its proximity and benefits under NAFTA, Canada remains the largest single supplier of steel to the U.S. market, accounting for 15% of imports (see Table 1). Having said that, the U.S. has a trade surplus with Canada in steel, highlighting the tightness of the supply links and the mutually beneficial relationship.
While China ranks only sixth currently in terms of U.S. steel imports, it was the top exporter between 2006 and 2008, as its exports grew tenfold in five years In fact, nearly all of the increase in global production since 2000, has been in China as it expanded six-fold to account for 50% of global output – up from a 15% in 2000 and 8% in 1990. - The rise has been even more pronounced in the aluminum market, where China’s share of global production rose from just 5% in 2000 to 55% currently. U.S. producers have seen production and employment shares fall just as sharply, down by nearly half (Chart 4). Canada dominates the U.S. import market as a supplier accounting for 40% of U.S. imports, followed by China, Russia, and the U.A.E. at near 10% apiece.
Chart 4: Steel and Aluminum Production Jobs in Long Term Decline
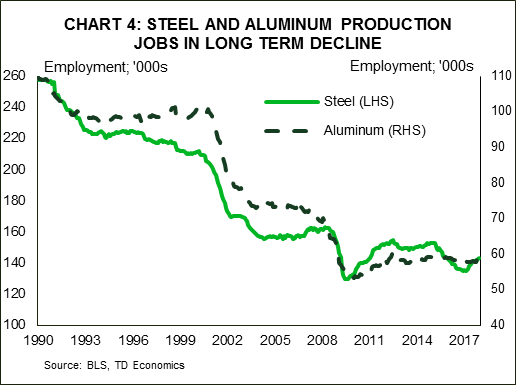 Chart 5: Chinese Production Surges After WTO Entry
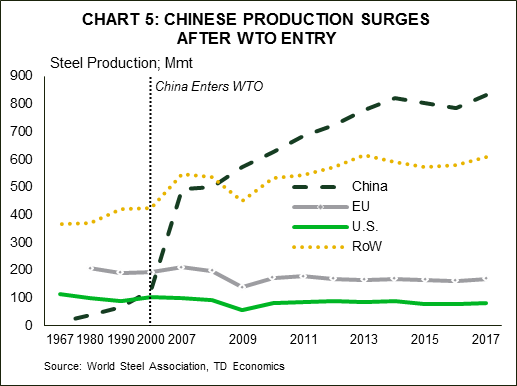 China’s push to become a key supplier to the world economy (Chart 5) has received much attention, due to its speed and substantial use of state subsidization. Moreover, the Chinese efforts to grow market share have been instrumental in keeping global steel prices down.
In Defense of National Security
U.S. trade cases have typically been brought about by businesses and industry organizations, with actions then implemented in cases where there is evidence of injury to domestic industries, particularly as a result of subsidies or unfair trade practices. In contrast, the steel and aluminum tariffs just signed were initiated by the government and used a relatively uncommonvi “national security” provision following an investigation under Section 232 of the Trade Expansion Act of 1962. The rationale for steel and aluminum tariffs is centered on the national need to maintain domestic production levels sufficient to satisfy the Department of Defense’s national defense requirements as well as the needs of critical infrastructure sectors, such as power grids, transportation, water, and energy generation systems. Achieving this would require a level of domestic steel and aluminum production consistent with an 80% of the 2017 utilization rate of factors of production.
Potential economic impacts
Chart 6: 2002 Tariffs Hit Non-NAFTA Imports, Raised Production
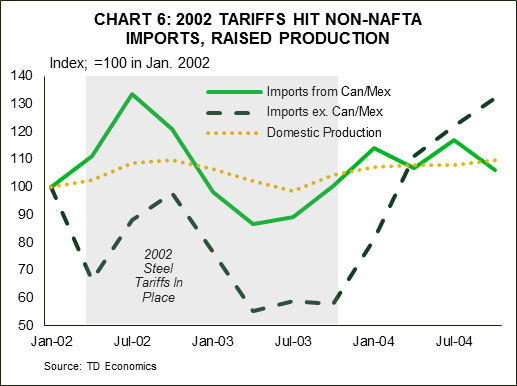 Assessing the potential economic impacts of the tariff plan is a complex exercise, but we look to history for to offer some insight. After launching an investigation under Section 202 of the Trade Act of 1974 seeking to determine whether challenges faced by the U.S. steel industry merited trade actions, the Bush administration raised import tariffs on steel, ranging from 8-30%vii, to help shore up the strategically important industry. Those tariffs were comparable to the current levels, though more targeted, and narrower in scope at just over half of all steel imports. Moreover, they exempted Canada and Mexico, as well as nearly eighty developing countries. Steel prices surged over 20% in the aftermath of the tariff hike, while utilization increased alongside a near 10% rise in domestic production. At the same time, imports fell more than 28% with the exception of those from NAFTA partners which increased 7% (Chart 6). The tariffs were established for three years but were cancelled in December 2003 – some fifteen months early.
Times have changed since then on many fronts. The structure of the steel market differs, with China accounting for a larger share of global production. Its non-market structure means that supplies may be less susceptible to changes in near-term market conditions. In addition, the U.S. shift towards tariffs is occurring at a time in the economic cycle when inflation risks are brewing. This may limit the extent and speed at which the steel and aluminum industries can ramp-up production beyond existing capacity amidst scarce labor and more aged equipment.
Scenario 1A: Status quo (exemptions and tariffs as signed, limited retaliatory measures)
The impacts from the imposition of tariffs will be most apparent in the United States, where it is a classic case of winners and losers: producers of steel and aluminum benefit while the steel-intensive manufacturers and, to a lesser extent, nonresidential builders and oil & gas drillers lose from higher input costs.
Price (inflationary): U.S. prices of steel and aluminum should rise by less than the full tariff amount given Canada and Mexico’s exemption. We assume (conservatively) that steel prices rise by around 20% and aluminum by 8%, pushing up producer prices, particularly across industries heavily-reliant on steel/aluminum as inputs. The higher costs would then flow through to the CPI, but any pass-through potentially limited by the improved profit margins from the recently-implemented business tax cuts. However, we still expect car prices to rise by about 1%, adding nearly $300 to the sticker price, with US CPI some by 0.2% higher over eight quarters, adding about 0.1 percentage points to the annual inflation rate.
Output (modest drag): domestic steel and aluminum production will ramp-up by over 10% within a year of implementation, with employment expected to increase by about 5,000 to 10,000 in these sectors nationally – U.S. Steel (500 jobs, IL) and Century Aluminum (300 jobs, KY) already announced production increases. But, these gains will be offset by losses of 25,000 to 50,000 in steel-intensive manufacturing made less competitive by higher domestic metal prices. Industries such as: fabricated metals, machinery, autos, aerospace, and other transport equipment will be hardest hit (see Table 2). Higher prices will reduce consumer’s buying power, diluting some of the positive impact on spending from the tax cuts embodied in the recent tax cut. Overall, growth is likely to be a touch lower in 2018, while net employment drops by a slight 20,000 to 40,000 relative to business-as-usual levels.
Monetary policy (tightening tilt) – the upward pressure on prices from these and other tariffs will only further complicate the Fed’s job of engineering a soft landing. While central banks tend to look through one-time shocks, it would provoke a response to the extent that those shocks combine with already existing economic pressures to increase future inflation expectations. The price impact of the tariffs raise the risk the Fed will need to raise rates four times this year and maybe more.
U.S. dollar (appreciation) – these tariffs should narrow the trade balance by $10 to $30 billion per year, as well as contribute to marginally higher inflation and tighter Fed policy, which are all unambiguously U.S. dollar positive. Currency movements are likely largely priced in, but further targeted U.S. protectionist actions could drive the U.S. dollar higher, while significant retaliatory tariffs would do the opposite.
Canadian impact (modestly growth positive) – Canada’s temporary exemption is a better outcome than was initially feared. It could help boost employment by about 1,500 across the steel and aluminum sectors to compensate for the additional demand that will need to be met as other countries pull-back exports on the tariffs. But, ultimately, the employment levels in the steel and aluminum industries are small relative to the entire labor market, at around 24,000 and 10,000, respectively, and the additional demand is unlikely to cause a ramp-up in investment across the Canadian primary metal sector – particularly in light of the temporary nature of the exemptions which adds uncertainty. Importantly, maintainting the exemption will also likely require the Canadian government monitor and prevent the flood of Canadian markets with international steel and aluminum intended to circumvent the U.S. tariffs, so as to not be viewed as complicit.
A cloud of uncertainty will indeed continue to overhang these and other tradeable sectors as NAFTA talks proceed slowly and risk getting delayed into 2019. The Canadian dollar, which has been losing ground recently, is likely to remain on the back foot. And, as the Bank of Canada indicated at its recent rate decision, trade uncertainty is a key reason why it will remain cautious in raising rates. It is also instrumental for why we believe there will be only one further rate hike this year.
Other impacts are expected to be modest under the current plan where Canadian producers are exempt. There will be some knock-on effect on prices from the U.S. tariffs directly, through higher North American steel and aluminum prices, as well as indirectly through the Canadian dollar. Overall impacts on Canadian CPI are estimated to be positive, but relatively marginal.
Scenario 1-B: Exemptions extended to all countries except those outlined by Commerce
Aside from the exclusions already provided to Canada and Mexico, this scenario would have additional countries apply, and be granted, exemptions to the tariffs, except for the fourteen outlined in the Commerce reports: 12 for steel and 5 for aluminum. Since any new exceptions will most likely be offset by higher tariffs on those not-exempted, total U.S. imports of steel and aluminum would remain unchanged. In the extreme case, in which all unlisted countries got exempted, tariffs would rise to 53% and 23.6% for the fourteen paying the tariffs.
By design such a scenario would only see the source of the imports into the U.S. change, while the volume of imports, the subsequent domestic production, and prices would be by and large unchanged with impacts as in the “status quo” or 1-A scenario. But, in the case of Canada, the modestly higher output and employment from displacing from other countries exports in scenario 1-A, would dissipate as more countries got exempted.
Scenario 2: tariffs are implemented on Canadian steel and aluminum
Under this scenario, the impacts on Canada would clearly be more significant than under either of the scenario 1 exemptions. But, on the face of it, those impacts appear quite modest in the context of the broader job market. Hiring in the primary metal sector would drop by as much as 5,000, with the concentration within Ontario and Quebec. Inflation would be higher on steel and aluminum costs, as well as an even lower loonie.
But, here is where an assessment gets more complex. The imposition of tariffs would overlay already contentious NAFTA negotiations. This would likely increase Canadian economic uncertainty and market volatility. If the administration looks poised to withdraw from NAFTA with 6 months of notice, the Canadian dollar would fall under significant pressure – by as much as 5-10%. This would help shield exporters from the effects of the higher tariffs, but also boost inflation temporarily. The Bank of Canada should see through the move with relatively little implication for monetary policy, with rates already depressed on NAFTA break-up.
Scenario 3: All-out global trade war
We view such a scenario as highly unlikley and consider it the worst of the worse outcomes, making any prediction of economic impact even more complex. Such a war would presumably start as countries engaged in subsequent rounds of tariff placement across varying products. The ensuing uncertainty would hamper investment and exports, weighing on global growth. The scenario would also have severe financial market implications, with increased volatility and flight to safety. In fact, this scenario could be a recession-trigger should credit-spreads widen and corporate costs rise both through this channel and that of production inputs. In addition, market deterioration would erode business and household confidence. This would lead to higher values of US dollar, yen, and franc, and increased demand for the safest government bond yields, pressuring yields lower. In a “best case” scenario, a trade war that occurs gradually and over a long period could instead result in a stagflation scenario – inflation accelerating on higher prices, and growth stalling from output reduction.
Bottom line
Despite the overarching anxiety about the recent steel and aluminum tariffs, there was a sigh of relief within financial and political spheres, particularly in Ottawa and Mexico City. The details of the document and rhetoric coming out of the White House were generally constructive in so far as leaving open the possibility for further exemptions. This has left many hopeful they can dodge the bullet, while at the same time readying their own lists of potential tariffs they could retaliate with should an exemption not be granted. We believe most countries that seek an exemption, with the exception of those outlined as bad-apples by the Commerce Department, should be able to win it. On the other hand, those with little hope of securing an exemption will likely pursue retaliatory tariffs. While we cannot rule out a risk that the these tariffs could set in motion a chain of events whereby countries impose successive rounds of tariffs on each other, we don’t view a trade war as the most probable scenario. Ultimately we hope cooler heads will prevail.


