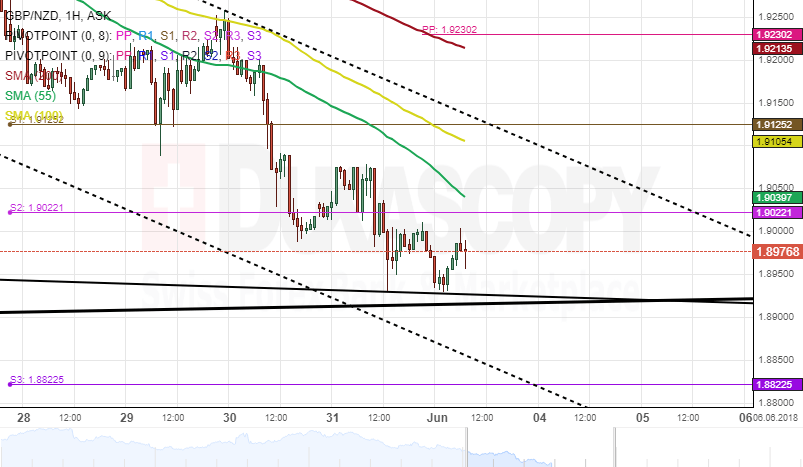
The bearish sentiment which began mid-May has guided the British Pound down against the New Zealand Dollar. This marks a 3.80% decrease in price within the last two weeks.
A strong resistance cluster set by the 100– hour simple moving average and the weekly pivot point at 1.9230 has pushed the exchange rate further south. it seems that this may point to a continuous decline for the pair.
Meanwhile, technical indicators flash bullish momentum during the following week, thus indicating that some upward correction is likely to occur next week. The pair has to surpass the monthly S2 at 1.90 before such corrective moves happen.