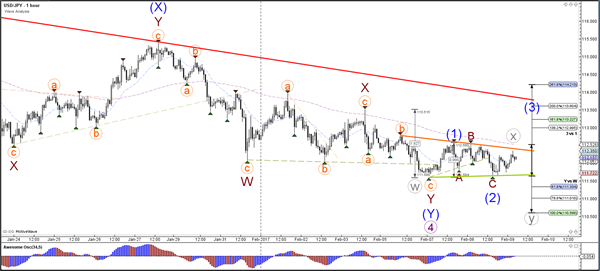
Currency pair USD/JPY
The USD/JPY seems to have made a double bottom at the 38.2% Fibonacci retracement level of wave 4 vs 3. A break of the bottom would still encounter a larger support trend line (green). Price needs to break above resistance (orange/red) trend lines before a new uptrend becomes more likely.
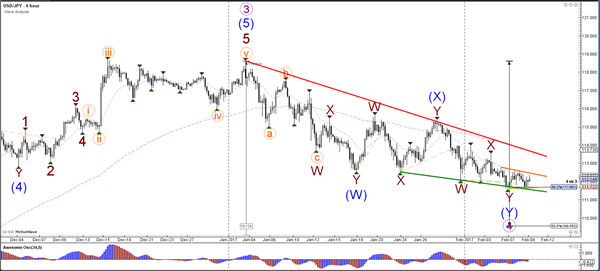
The USD/JPY could either be building a new uptrend via a 123 (blue) or a larger bearish correction via a WXY (grey). The trend lines indicate contracting triangle pattern and are critical to see whether a breakout could occur later today.
Currency pair EUR/USD
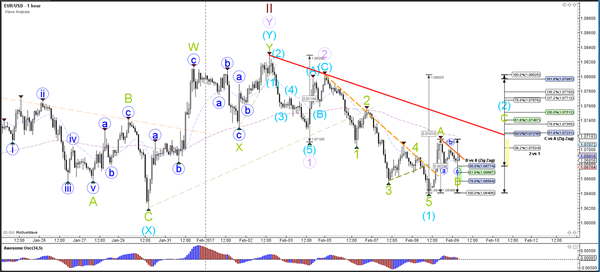
The EUR/USD failed to break below the support trend line (blue) and to reach the 161.8% Fibonacci target of wave 3 vs 1, which means that another wave 1-2 (blue) is likely unless price were to break above the top of wave 2 (purple).
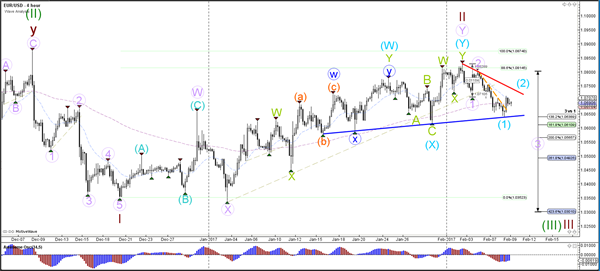
The EUR/USD is most likely building an ABC (green) zigzag within wave 2 (blue) unless price breaks below the 100% level of wave B vs A.
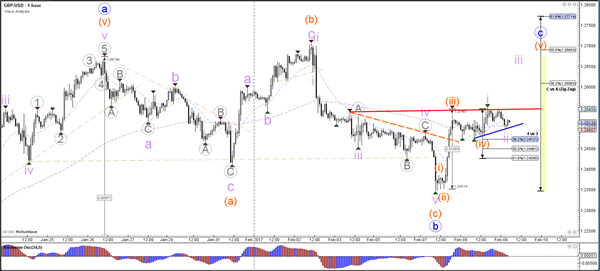
Currency pair GBP/USD
The GBP/USD is building an ABC (blue) correction within wave 4 (purple). Price could retest the larger resistance trend line (brown) and Fibonacci levels of wave C if it breaks the local resistance (red).
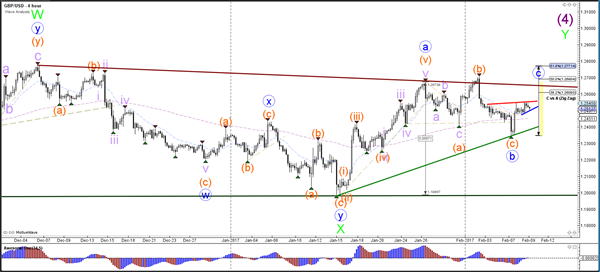
The GBP/USD is probably in a wave 5 (orange) of the wave C (blue) unless price breaks the support trend line (blue) which would make a correction towards the 50% Fibonacci level of wave 4 vs 3 likely.