
A note on lower timeframe confirming price action…
Waiting for lower timeframe confirmation is our main tool to confirm strength within higher timeframe zones, and has really been the key to our trading success. It takes a little time to understand the subtle nuances, however, as each trade is never the same, but once you master the rhythm so to speak, you will be saved from countless unnecessary losing trades. The following is a list of what we look for:
- A break/retest of supply or demand dependent on which way you’re trading.
- A trendline break/retest.
- Buying/selling tails – essentially we look for a cluster of very obvious spikes off of lower timeframe support and resistance levels within the higher timeframe zone.
- Candlestick patterns. We tend to only stick with pin bars and engulfing bars as these have proven to be the most effective.
EUR/USD
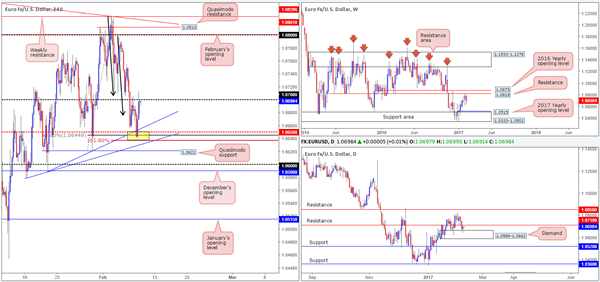
In Wednesday’s report you may recall that our desk highlighted the possibility of a bounce materializing from the H4 mid-way support at 1.0650. Our rationale behind this approach came from seeing a selection of different structures converging at this point: a H4 AB=CD 161.8% ext. at 1.0637, a deep H4 88.6% retracement at 1.0644, a H4 trendline support etched from the low 1.0589 (yellow zone) and was also seen positioned within daily demand at 1.0589-1.0662. Unfortunately, we missed this entry by a few pips as we were looking to jump aboard just ahead of the H4 161.8% ext. around the 1.0638ish region. Well done to any of our readers who managed to lock down a position here!
As of current prices, we can see that the pair recently caught an offer around the 1.0700 neighborhood. This level – coupled with a nearby daily resistance seen just 10 pips above the psychological level at 1.0710, may call for the single currency to withdraw from this point today.
Our suggestions: With the daily confluence seen around the 1.0700 region, and taking into account that the weekly timeframe is currently trading with a reasonably strong downside bias at the moment (the next support target on tap falls in at around a weekly support area drawn from 1.0333-1.0502), our team would consider an intraday short from 1.0700 today. However, this will only be possible on the condition that we are able to pin down a lower-timeframe sell signal (see the top of this report for ideas on how to use the lower-timeframe candles to enter the market). The first take-profit target, for us personally, would be the above noted H4 trendline support.
Data points to consider: US Jobless claims at 1.30pm GMT.
Levels to watch/live orders:
- Buys: Flat (stop loss: N/A).
- Sells: 1.0700 ([wait for a lower-timeframe signal to form before pulling the trigger] stop loss: dependent on where one confirms this level).
GBP/USD:
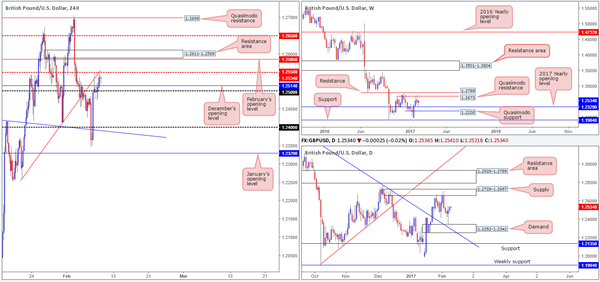
Cable is marginally stronger today after finding support around the 1.25 handle and conquering December’s opening base at 1.2514. While the pair chalked up its second consecutive daily gain yesterday, alongside both the weekly and daily timeframes showing room for the pair to continue advancing north this week, the H4 chart unfortunately does not share the same view at this time. Not only is there a mid-way resistance at 1.2550 currently in motion, there’s also the nearby February opening level at 1.2586 and a H4 resistance area at 1.2611-1.2589. Collectively, these H4 structures could potentially throw a spanner in the works in regards to the possibility of further buying today.
Our suggestions: On the account that the H4 shows very little ‘wiggle room’ to the upside this morning, despite the higher timeframes suggesting that higher prices could be on the cards, we will not be looking to trade this unit today. The risk/reward would clearly not be in our favor!
Data points to consider: BoE Gov. Carney speaks at 6.30pm. US Jobless claims at 1.30pm GMT.
Levels to watch/live orders:
- Buys: Flat (stop loss: N/A).
- Sells: Flat (stop loss: N/A).
AUD/USD
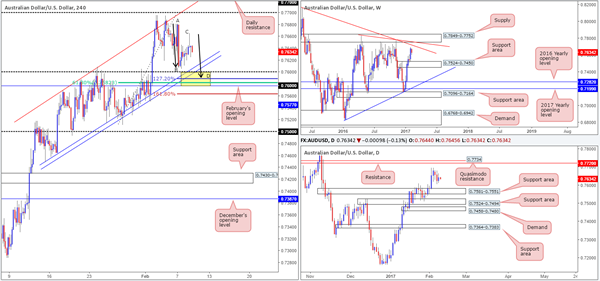
While the commodity-linked currency managed to record a small gain during the course of yesterday’s segment, breaking a two-day bearish phase, there has been very little change seen to the structure of this market. As a result of this, our desk remains drawn to the 0.7577/0.76 H4 support area (yellow zone) today. Supporting a bounce from this zone we have the following converging structures:
- A H4 AB=CD 127.2% ext. at 0.7589.
- A H4 61.8% Fib support at 0.7582.
- February’s opening level at 0.7577.
- Round number 0.76.
- We also have the top edge of a daily support area at 0.7581 bolstering the above noted H4 support zone.
Our suggestions: Based on the above confluence, we feel a long from the 0.7589 mark is feasible. To be on the safe side though, stops may want to be placed beyond the H4 161.8% ext. at 0.7564 (0.7562).
Data points to consider: Australian quarterly business confidence report at 12.30am. US Jobless claims at 1.30pm GMT.
Levels to watch/live orders:
- Buys: 0.7577/0.76 ([an area that can, dependent on the time of day, possibly be traded without additional confirmation] stop loss: 0.7562).
- Sells: Flat (stop loss: N/A).
USD/JPY:
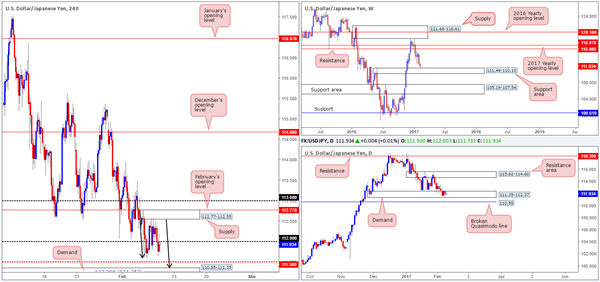
As you can see from the weekly chart this morning, the current weekly candle is trading within a stone’s throw away from a weekly support area drawn from 111.44-110.10. Looking down to the daily candles, however, the pair continues to trade within the walls of a daily demand area seen at 111.35-112.37. Should this zone give way, the next barrier of interest falls in at a nearby daily broken daily Quasimodo line at 110.58.
Over on the H4 chart, yesterday’s decline in value pulled the market beyond the 112 handle and ended the day in the red. Should 112 continue to hold as resistance, we may see the H4 candles complete the D-leg of an AB=CD bull pattern (see black arrows), terminating just ahead of a H4 demand area seen at 110.85-111.35.
Our suggestions: Should the H4 AB=CD formation complete, we would consider entering long just ahead of the H4 AB=CD 127.2% ext. at 111.25. The safest position for stops, in our opinion, would be beyond the above noted H4 demand. This trade is effectively based on the premise that price will, at that time, also be teasing the top edge of the aforementioned weekly support area. To avoid the possibility of a fakeout through this H4 demand to the daily broken Quasimodo line at 110.58, nevertheless, waiting for a H4 bull candle to form out of the current H4 demand could help to eliminate this.
Data points to consider: US Jobless claims at 1.30pm GMT.
Levels to watch/live orders:
- Buys: 111.25 region ([wait for a H4 bull candle to form before looking to execute a trade] stop loss: ideally beyond the trigger candle or alternatively below the H4 demand at 110.85-111.35).
- Sells: Flat (stop loss: N/A).
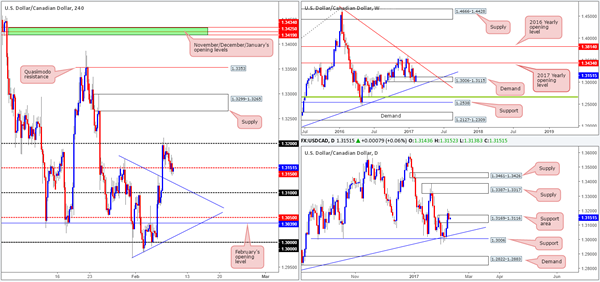
USD/CAD:
The 1.32 psychological level, as can be seen from the H4 chart, held ground for a second time in the early hours of yesterday’s segment. From this point on the USD/CAD spent the day grinding lower, likely fueled further by a rally in oil prices, which eventually saw the loonie engulf the H4 mid-way support level at 1.3150. For those looking to short based on price currently retesting this mid-level number, it may be worth noting that the daily candles are seen trading within a daily support area at 1.3169-1.3116, which happens to be bolstered further by a weekly demand area currently in play at 1.3006-1.3115.
Our suggestions: Instead of looking to short from 1.3150, we are watching for a H4 close back above this level. This – coupled with a retest of this number as support, followed up with a lower-timeframe buy signal could, in our humble opinion, be sufficient enough to consider a buy, targeting 1.32 and possibly beyond.
Data points to consider: US Jobless claims at 1.30pm GMT.
Levels to watch/live orders:
- Buys: Watch for a H4 close above 1.3150 and then look to trade any retest seen thereafter ([waiting for a lower-timeframe buy signal to form following the retest is advised before pulling the trigger] stop loss: dependent on where one confirms this level).
- Sells: Flat (stop loss: N/A).
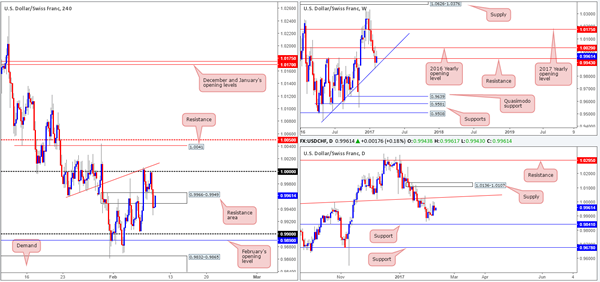
USD/CHF
Beginning with the weekly timeframe this morning, it’s pretty clear that the structure is somewhat restricted at the moment. Last week’s candle bounced off a weekly trendline support taken from the low 0.9443 and, as a result, is now seen interacting with a weekly resistance base coming in at 0.9943. Turning our attention to the daily timeframe, the daily candles are currently seen loitering mid-range between a daily trendline resistance drawn from the high 0.9956 and a daily support band at 0.9841.
Swinging across to the H4 timeframe, we can see that the H4 support area at 0.9966-0.9949 succeeded in bolstering price in the early hours of yesterday’s session. Unfortunately though, the Swissy was unable to muster enough strength to breach parity (1.0000) and from thereon tumbled lower, ultimately closing the day beyond the aforementioned H4 support zone.
Our suggestions: Seeing as how the H4 candles are, at the time of writing, seen retesting the recently broken H4 support area as resistance, would we consider this to be a stable enough zone to sell here with a target objective pegged at the 0.99 handle? Technically speaking, the current H4 resistance area boasts very little confluence and holds no connection to the higher-timeframe structures. Therefore, we would likely pass on sells from this area and expect the unit to advance and tap parity once more today. While shorting from this number carries slightly more weight given the convergence of a H4 trendline resistance extended from the low 0.9959, we would still advise waiting for additional confirmation (see the top of this report) before pressing the sell button, since a rally up to the aforementioned daily trendline resistance could very well take place.
Data points to consider: US Jobless claims at 1.30pm GMT.
Levels to watch/live orders:
- Buys: Flat (stop loss: N/A).
- Sells: 1.0000 region ([waiting for a lower-timeframe signal to form is advised before pulling the trigger] stop loss: dependent on where one confirms this level).
DOW 30
During the course of yesterday’s sessions the US equity market punched to a low of 20014, which has not only placed price within touching distance of H4 support coming in at 19989, it’s also formed the basis for a nice-looking H4 AB=CD bull pattern that completes around the 19982 mark (see black arrows). This – coupled with daily support at 19964, a H4 50.0% retracement level at 19968 and the weekly chart showing little standing in the way of a move higher, forms a strong area of support worthy of attention today, in our opinion.
Our suggestions: Before our team looks to commit to any long positions from the 19964/19989 region (yellow zone), however, we would need to see price strike the H4 161.8% ext. Waiting for H4 price to confirm this area is still recommended, nevertheless, since at least in our view, there is no clear area to place stops.
Data points to consider: US Jobless claims at 1.30pm GMT.

Levels to watch/live orders:
- Buys: 19964/19989 ([wait for a H4 bull candle to form before looking to execute a trade] stop loss: ideally beyond the trigger candle).
- Sells: Flat (stop loss: N/A).
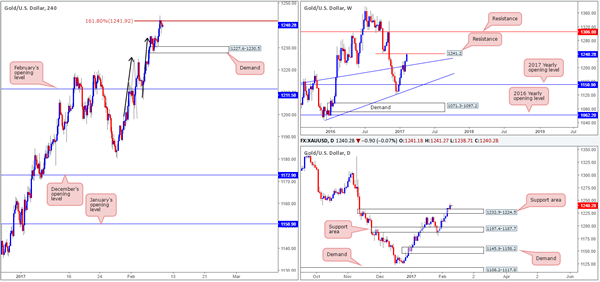
GOLD
Looking at the weekly chart this morning, the yellow metal recently struck the underside of a weekly resistance level seen at 1241.2. While this may be the case, down on the daily chart the bulls convincingly closed above daily supply at 1232.9-1224.5 (now acting support area). This does, of course, create somewhat of a conflict between the two higher timeframes. In our experience, however, it is usually the higher timeframe that leads the way, so we’re in favor of a selloff materializing in the not so distant future.
Over on the H4 candlesticks, bullion advanced up to the H4 AB=CD (see black arrows) 161.8% ext. at 1241.9 amid yesterday’s segment, which, as you can see, is holding ground for the time being. For those who read Wednesday’s report you may recall that we highlighted this zone as a possible reversal area. Given that the weekly resistance level is now in play, our team has shorted on the close of the last bearish H4 candle at 1239.6ish, with a stop logged in at 1245.4. Our first target objective can be seen at the H4 demand area formed from 1227.6-1230.5.
Levels to watch/live orders:
- Buys: Flat (stop loss: N/A).
- Sells: 1239.6 ([live order] stop loss: 1245.4).


