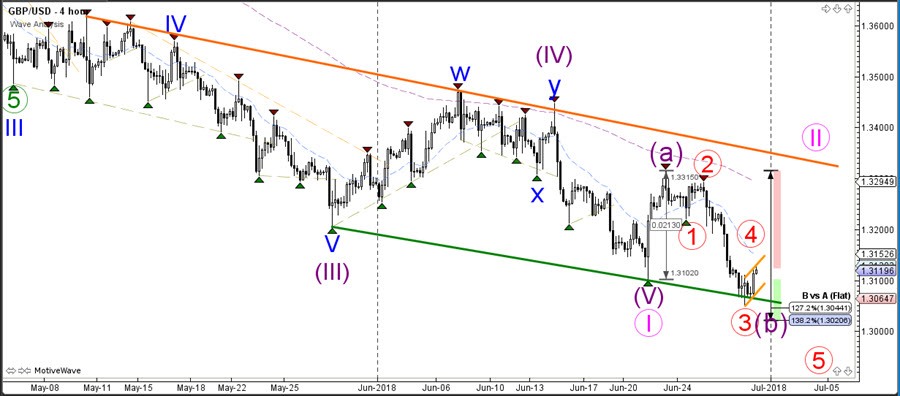
The GBP/USD showed stronger bearish momentum than the EUR/USD because price managed to break the previous bottom at 1.31 but price however did not manage to break the downtrend channel. Will GBP/USD reverse back up like the EUR/USD or continue with the downtrend?
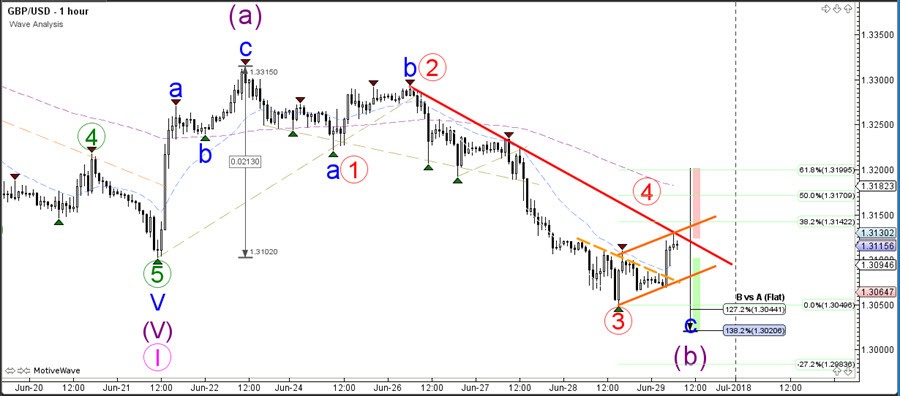
Both versions are in fact possible and are represented on the 4-hour image. A bullish bounce via a wave B (purple) correction is still possible because price has stayed above the 138.2% Fibonacci level. The alternative is that price is building a 12345 (red) pattern. In that case, price would need to respect the Fibs on the 1 hr chart and turn back down and break below the flag.
The GBP/USD needs to stay below the 38.2-50% Fibonacci zone otherwise a wave 4 (red) becomes unlikely. A bearish turn and break below the bear flag pattern channel (orange lines) could confirm a wave 4-5 (red) towards the -27.2% Fib target. A break above the 50% Fib makes an ABC (blue) within wave B (purple) more likely.