
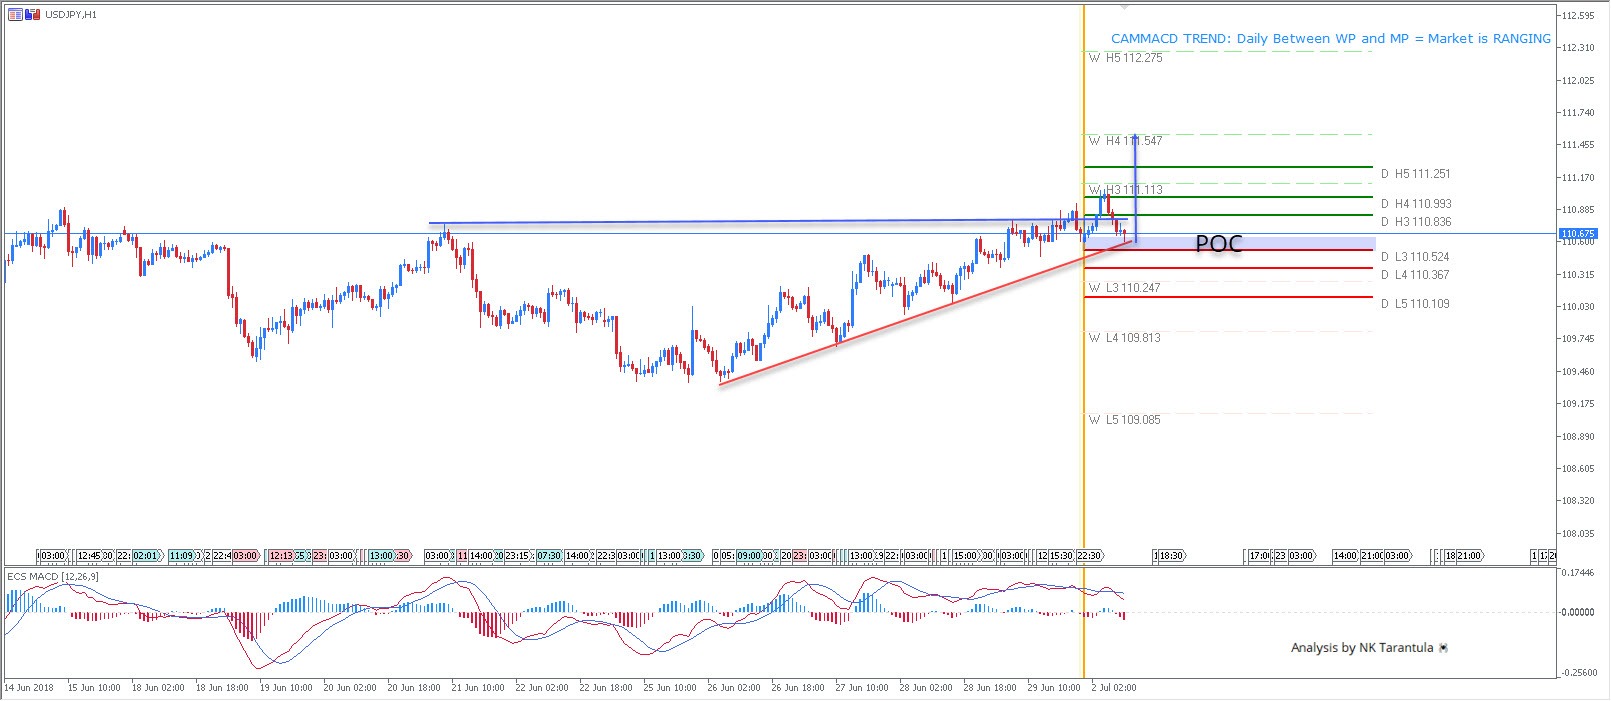
The USD/JPY has formed a flat top ascending triangle pattern. Although, the pattern is still running (no vortex has been formed), this is a bullish configuration. The price has already broken above the upper flat trend line and we might see a continuation above 111.00. In the case of a retracement 110.50-60 is the POC zone for a possible bounce. Targets are 111.00 and 111.54. Ideally the price should stay above 110.20, else we might see a bearish momentum.
W L3 – Weekly Camarilla Pivot (Weekly Interim Support)
W H3 – Weekly Camarilla Pivot (Weekly Interim Resistance)
W H4 – Weekly Camarilla Pivot (Strong Weekly Resistance)
D H4 – Daily Camarilla Pivot (Very Strong Daily Resistance)
D L3 – Daily Camarilla Pivot (Daily Support)
D L4 – Daily H4 Camarilla (Very Strong Daily Support)
POC – Point Of Confluence (The zone where we expect price to react aka entry zone)


