
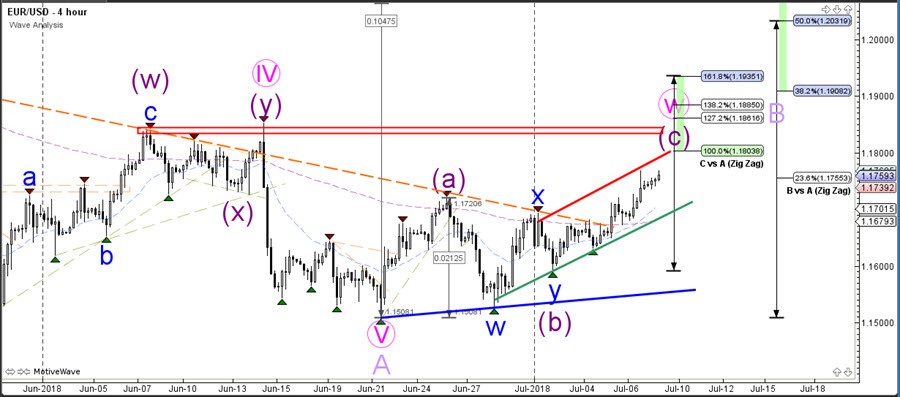
The EUR/USD uptrend channel is now approaching the previous top and key resistance zone (red), which is a bounce or break zone.
The EUR/USD seems to be building a wave C (purple), which could complete a wave W (pink) if the wave patterns on the image are correct. A larger WXY corrective pattern could take place within wave B (light purple). A strong bearish reaction and fall could indicate that a wave 4 pattern was finished (not a wave W) and price could make one more decline within a wave 5 (pink).
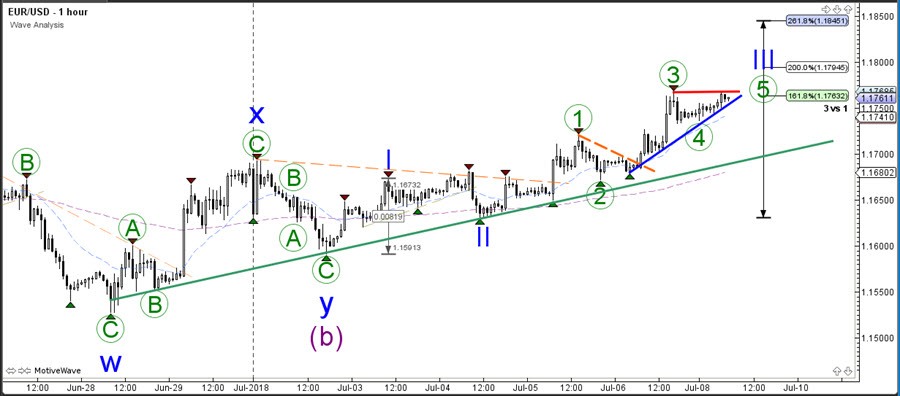
The EUR/USD is building an ascending wedge chart pattern. A bullish breakout could send the pair towards the Fibonacci targets of wave 3 (blue). One more wave 4 and 5 (blue) are possible once price completes wave 3 (blue).


