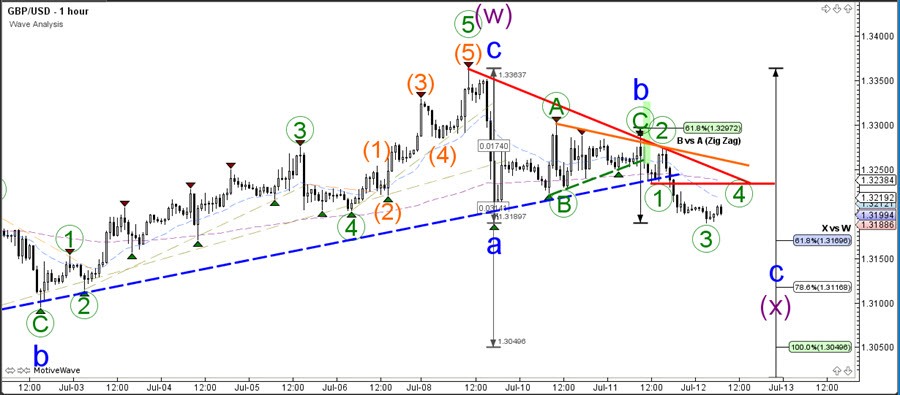
The GBP/USD broke the support trend line (dotted blue) of the mini triangle pattern and made a bearish breakout. What’s next?
The bearish price action seems to be relatively slow and corrective, which could indicate that the current WXY (purple) wave pattern is indeed correct. If price is indeed in a wave X (purple) now, then price is expected to bounce at the Fibonacci support levels of wave W vs X and make a new bullish rally. Strong bearish momentum could change the expected wave patterns however.
The GBP/USD indeed bounced at the Fibonacci resistance retracement levels of wave B vs A. The bearish turn around also caused price to break below the support trendlines. Price might now be building a 5 wave pattern but in that case price should not retrace back into wave 1 (red horizontal line). A break above the resistance trend lines could indicate a bullish reversal.