
Key Highlights
- Crude oil price topped near the $75.20-30 area and declined recently against the US dollar.
- There was a break below a major bullish trend line with support at $70.40 on the 4-hours chart of XTI/USD.
- The US Industrial Production in June 2018 increased 0.6%, similar to the forecast.
- Today in the US, the Building Permits figure for June 2018 (MoM) will be released, which is forecasted to post 1.330M (up from the last 1.301M).
Crude Oil Price Technical Analysis
Earlier this month, crude oil price struggled to break the $75.00-75.30 resistance area against the US Dollar. As a result, the price started a downward move and broke a major support at $72.50.
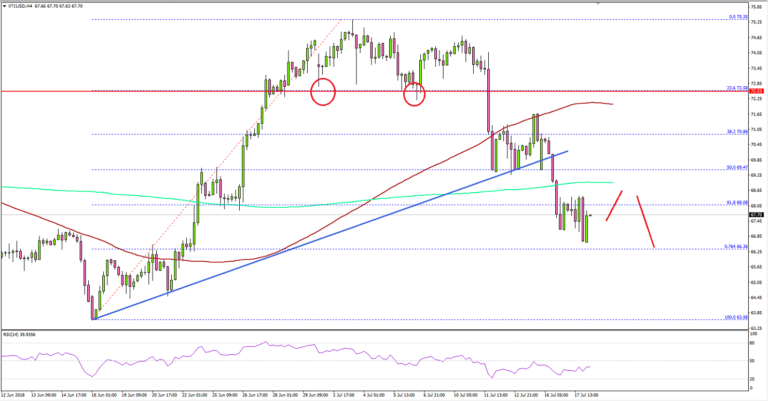
Looking at the 4-hours chart of XTI/USD, the price declined heavily after it broke the $72.50 support. During the decline, there was a break below a major bullish trend line with support at $70.40.
More importantly, the price also broke the 50% Fib retracement level of the last wave from the $63.58 low to $73.35 high. Lastly, there was a close below the $70.00 support and the 100 (red) simple moving average (4-hours).
The next key support sits near the $66.30 level and the 76.4% Fib retracement level of the last wave from the $63.58 low to $73.35 high. Below this, the price could decline further towards the $64.00 level.
On the other hand, if the price corrects higher, the previous support at $70.00 may perhaps act as a resistance. Above $70.00, the 100 SMA is a strong barrier near the $72.25 level.
Recently in the US, the Industrial Production report for June 2018 was released by the Board of Governors of the Federal Reserve. The market was looking for a rise of 0.6% in the production in June 2018, compared with the previous month.
The actual result was in line with the forecast as the Industrial Production increased 0.6% in June 2018, well above the last revised decline of 0.5%. The US Dollar was seen gaining traction after the release, and pairs like EUR/USD and GBP/USD corrected lower.
Economic Releases to Watch Today
- UK Producer Price Index June 2018 (MoM) – Forecast +0.3%, versus +0.4% previous.
- UK Consumer Price Index June 2018 (YoY) – Forecast +2.6%, versus +2.4% previous.
- UK Core Consumer Price Index June 2018 (YoY) – Forecast +2.2%, versus +2.1% previous.
- Euro Zone CPI for June 2018 (YoY) – Forecast +2.0%, versus +2.0% previous.
- Euro Zone CPI for June 2018 (MoM) – Forecast +0.1%, versus +0.5% previous.
- US Housing Starts June 2018 (MoM) – Forecast 1.320M, versus 1.350M previous.
- US Building Permits June 2018 (MoM) – Forecast 1.330M, versus 1.301M previous.


