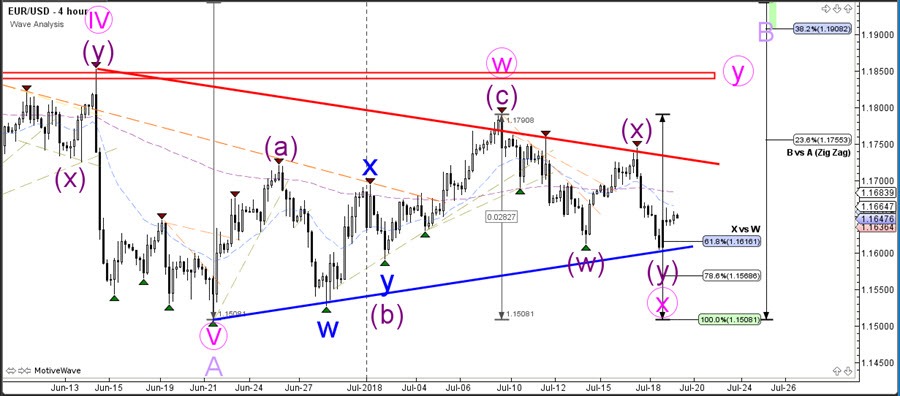
The EUR/USD made a bullish bounce at the support trend line and triangle chart pattern, which is a key decision zone for a bull reversal or bear breakout.
The wave patterns indicated in the image are expecting a bullish bounce as part of a WXY (pink) correction. A bearish breakout could still be part of an expanded wave X (pink) unless price shows strong bearish momentum, which could indicate a bearish breakout and trend.
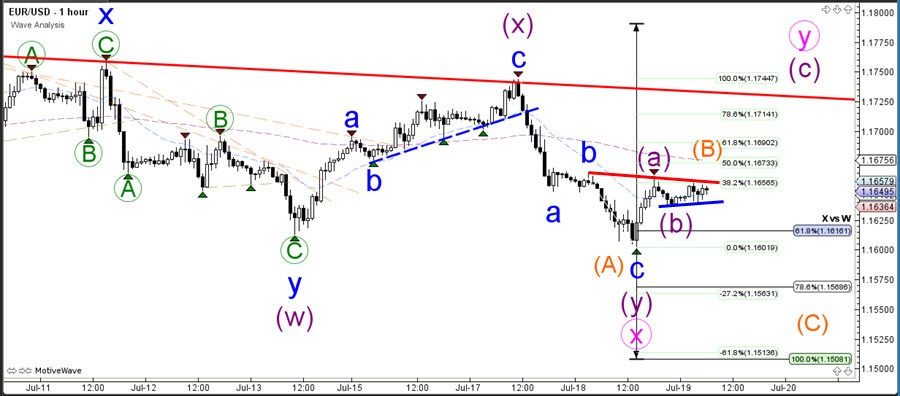
As an exception, the EUR/USD 1 hour chart offers two scenarios where both a bearish and bullish ABC pattern could be taking place. The breakout direction could indicate which ABC pattern might prevail although traders need to watch out for false breakouts as well.