
EUR/USD
The EUR/USD showed a strong bullish reversal at the support zone (blue) of the triangle pattern and sideways consolidation zone (blue).
Daily chart:
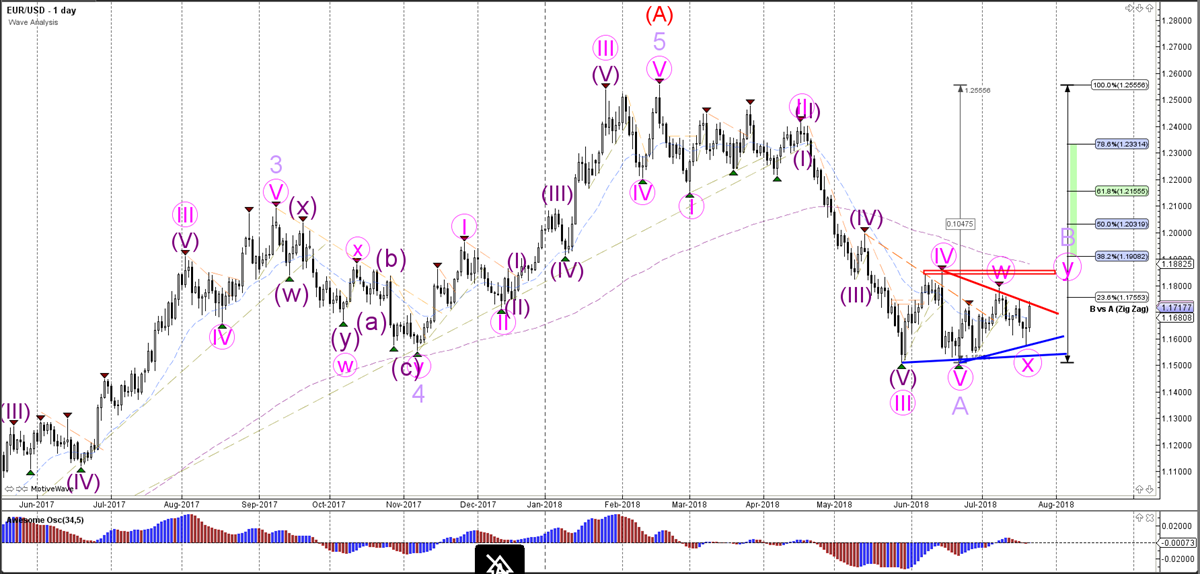
The EUR/USD seems to be building a bearish ABC (purple) correction within wave B (red).
Weekly chart:
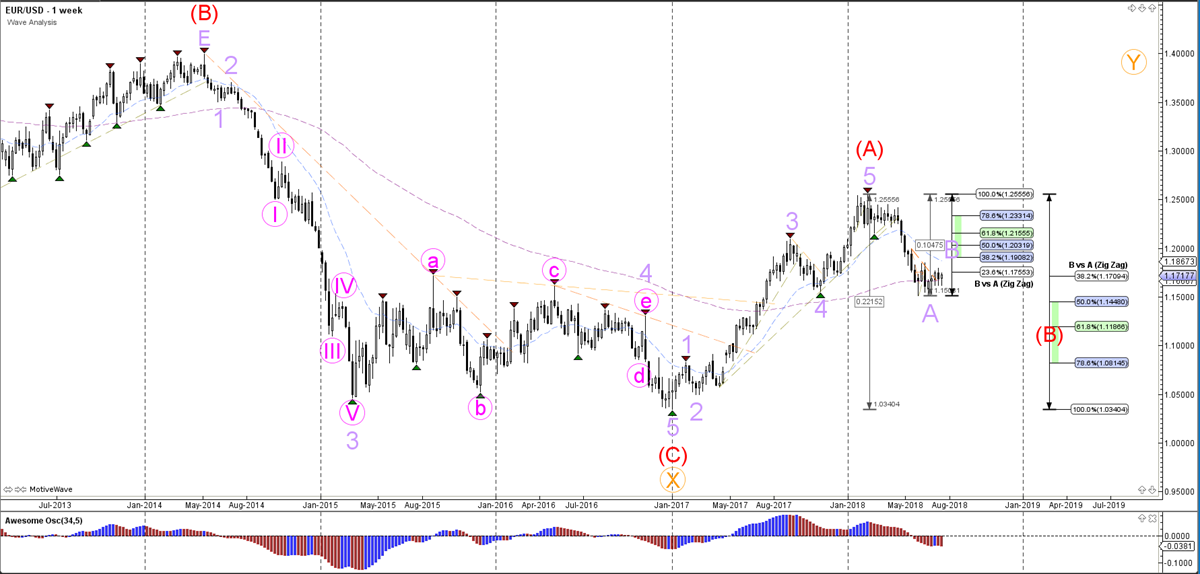
The EUR/USD has probably completed wave A (red) and price is now most likely retracing to the Fibonacci levels of wave B (red).
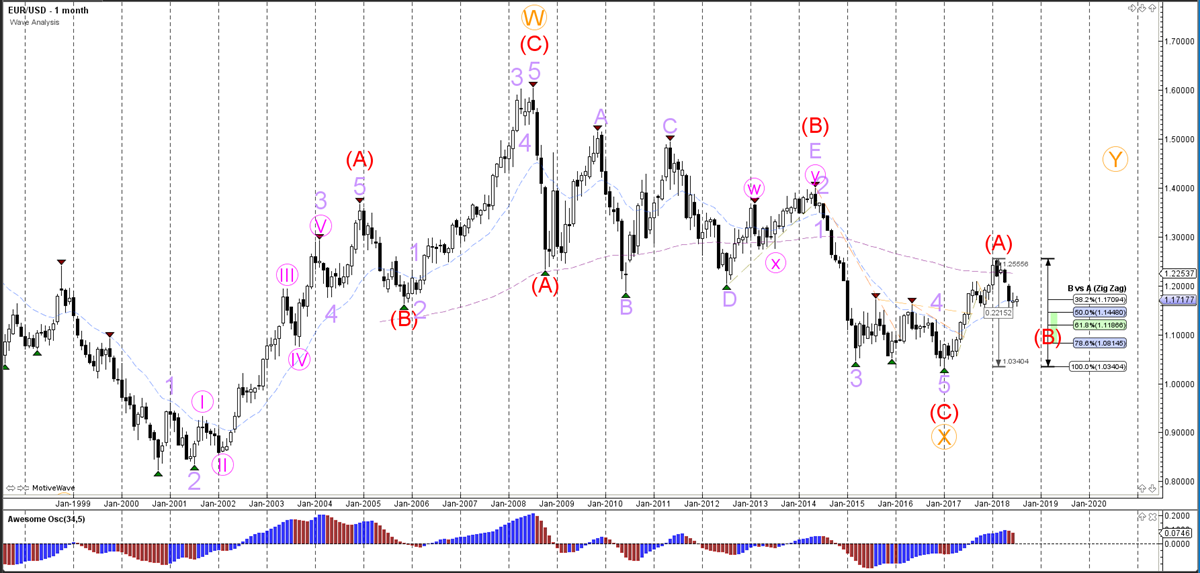
Monthly chart:
GBP/USD
The GBP/USD remains in a downtrend channel but the strong bullish reversal at the channel support suggests a larger bullish correction.
Daily chart:
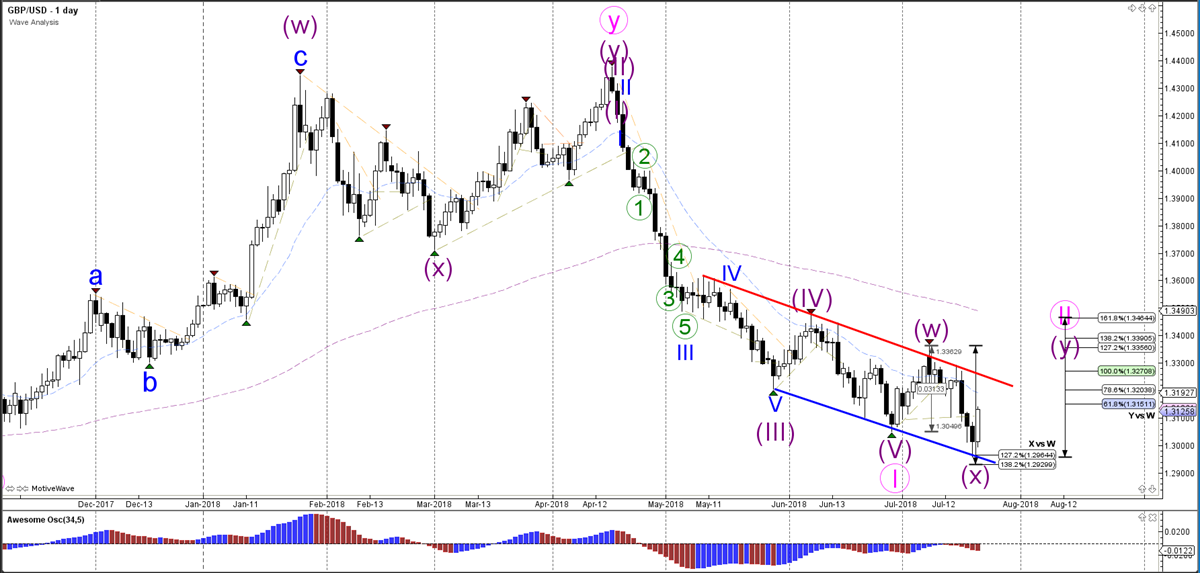
The GBP/USD has probably started the bearish wave 5 after price has completed a wave 4 (light purple) correction.
Weekly chart:
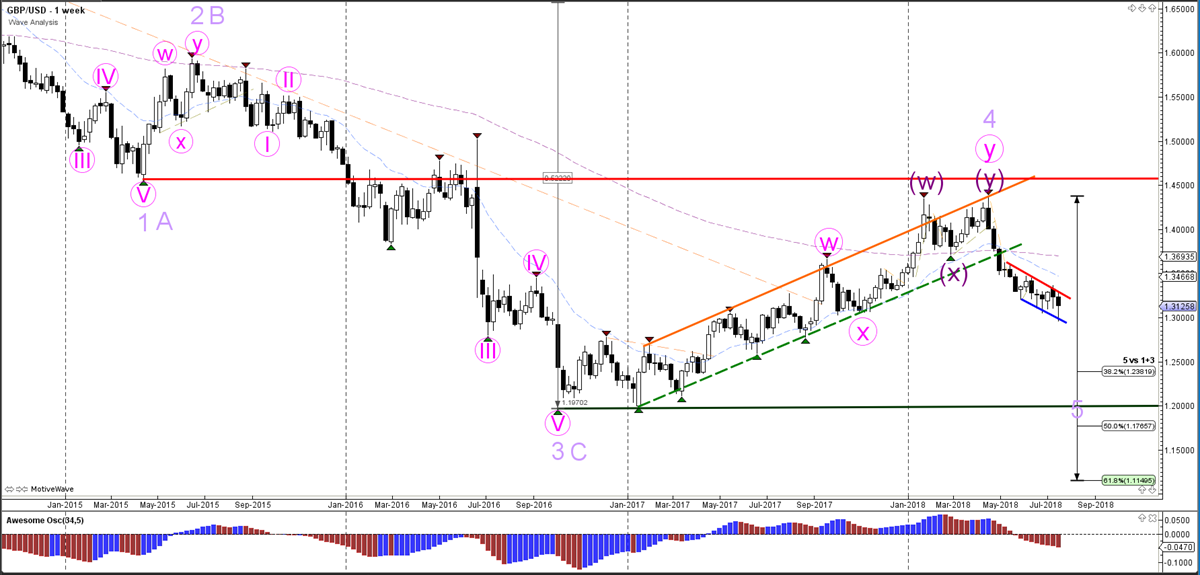
The GBP/USD bearish breakout could see the continuation of the wave 5 (purple) whereas a bullish break above resistance (red) could indicate that a wave C has been completed at the bottom.
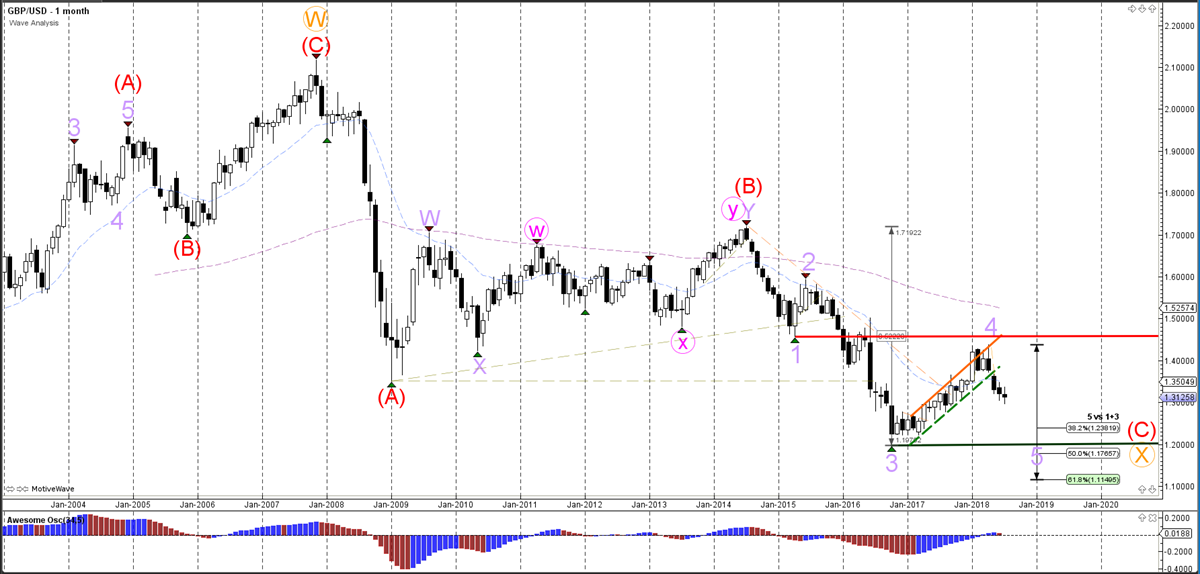
Monthly chart:
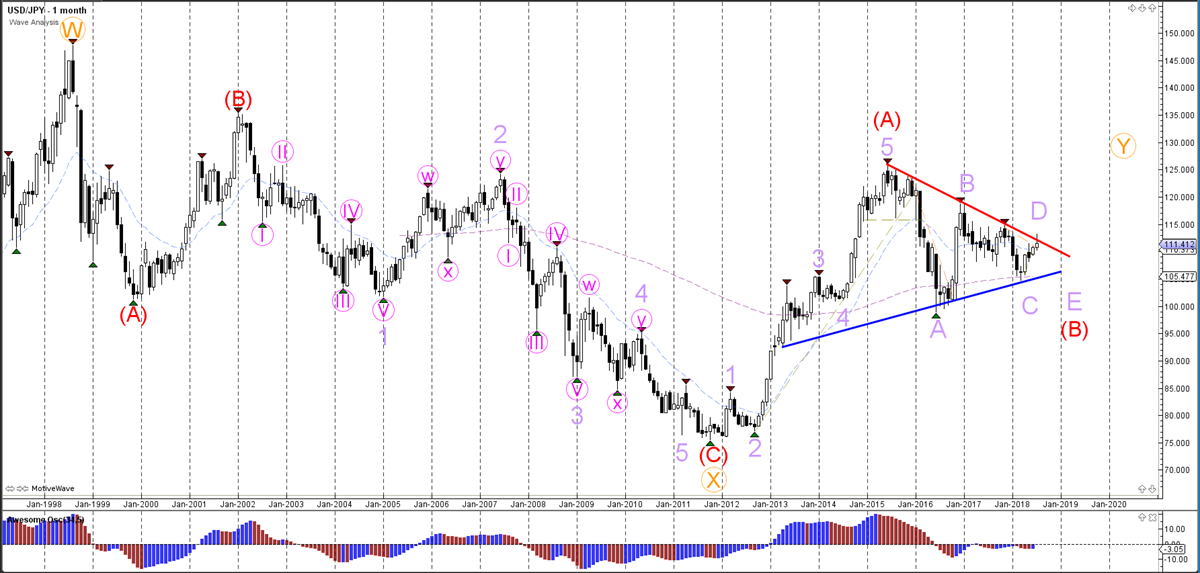
USD/JPY
The USD/JPY seems to have completed a WXY (pink) pattern within wave D (light purple) and could be building a new ABC pattern within wave E.
Daily chart:
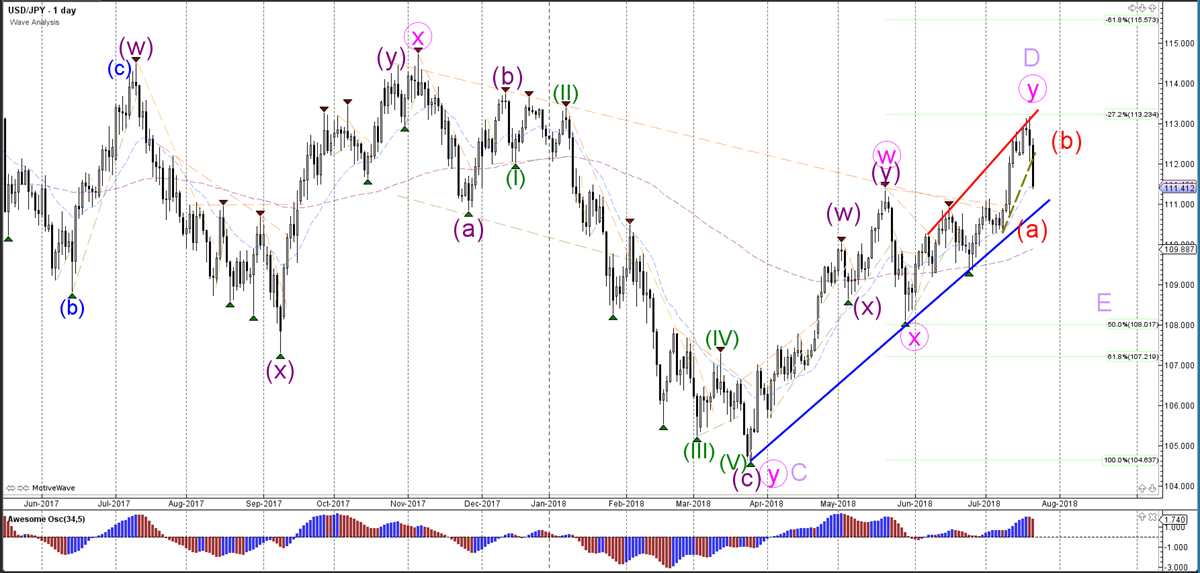
The USD/JPY could be building an ABCDE triangle (light purple) within wave B (red).
Weekly chart:
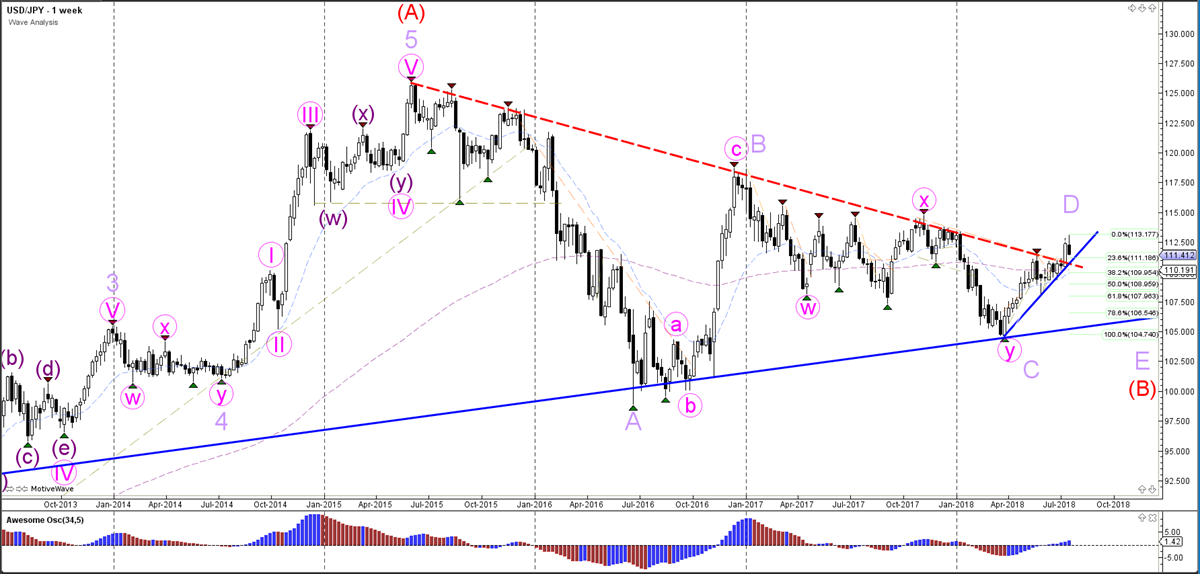
The USD/JPY is in the wave D (light purple) of the triangle pattern.
Monthly chart:


