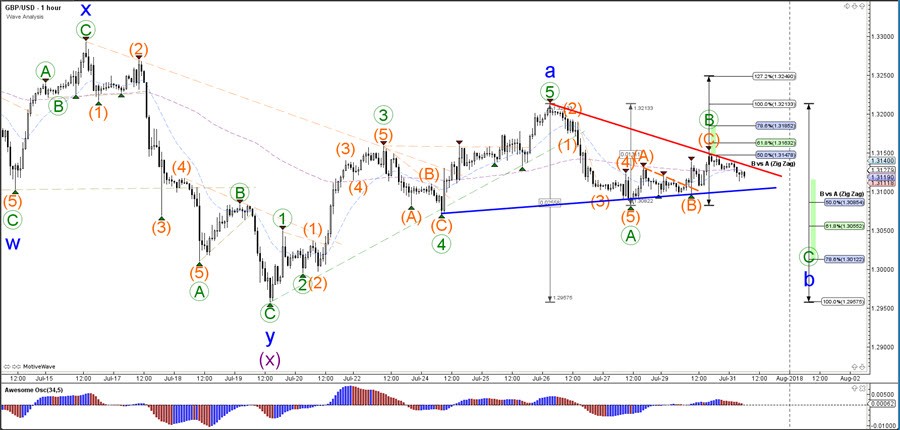
The GBP/USD made a bullish bounce at the 50% Fibonacci level but price action was slow and choppy. The corrective price pattern seems to be confirming an extended and deeper bearish wave B (blue).
The GBP/USD is expected to eventually finish the wave B (blue) at one of the Fibonacci levels of wave B vs A which could act as a bouncing spot. The Cable will need to break above the resistance lines before a bullish wave C is confirmed whereas a break below the Fibs of wave B vs A makes a wave B (blue) less likely.
The GBP/USD bullish bounce seems to have created an ABC (orange) correction within wave B (green) after stopping and bouncing at the 50% Fibonacci level of wave B vs A. The triangle chart patterns and its support and resistance trend lines remain critical. If price breaks the resistance trend line (orange), then a larger bullish breakout should occur towards a deeper Fib. If price breaks the support trend line (blue), then a larger bearish breakout should take price to deeper Fibonacci levels of wave B vs A (blue).