
The EUR/USD currency pair
Technical indicators of the currency pair:
Prev Open: 1.17033
Open: 1.16820
% chg. over the last day: -0.15
Day’s range: 1.16766 – 1.16911
52 wk range: 1.0571 – 1.2557
During yesterday’s trading session, there was a variety of trends on the EUR/USD currency pair. Yesterday, important economic statistics from the US and the Eurozone were published. Today, investors took a wait-and-see position before the Fed interest rate decision. It is expected that the regulator will leave the interest rate unchanged at 2.00%. At the moment, the technical pattern is ambiguous: a trading instrument is in a sideways trend. The key support and resistance levels are 1.16700 and 1.17000, respectively. We recommend opening positions from these marks.
The news feed on 2018.08.01:
The index of economic activity in the manufacturing sector in Germany at 10:55 (GMT+3:00);
ADP nonfarm employment change at 15:15 (GMT+3:00);
The index of economic activity in the US manufacturing sector from ISM at 17:00 (GMT+3:00);
Fed interest rate decision at 21:00 (GMT+3:00).
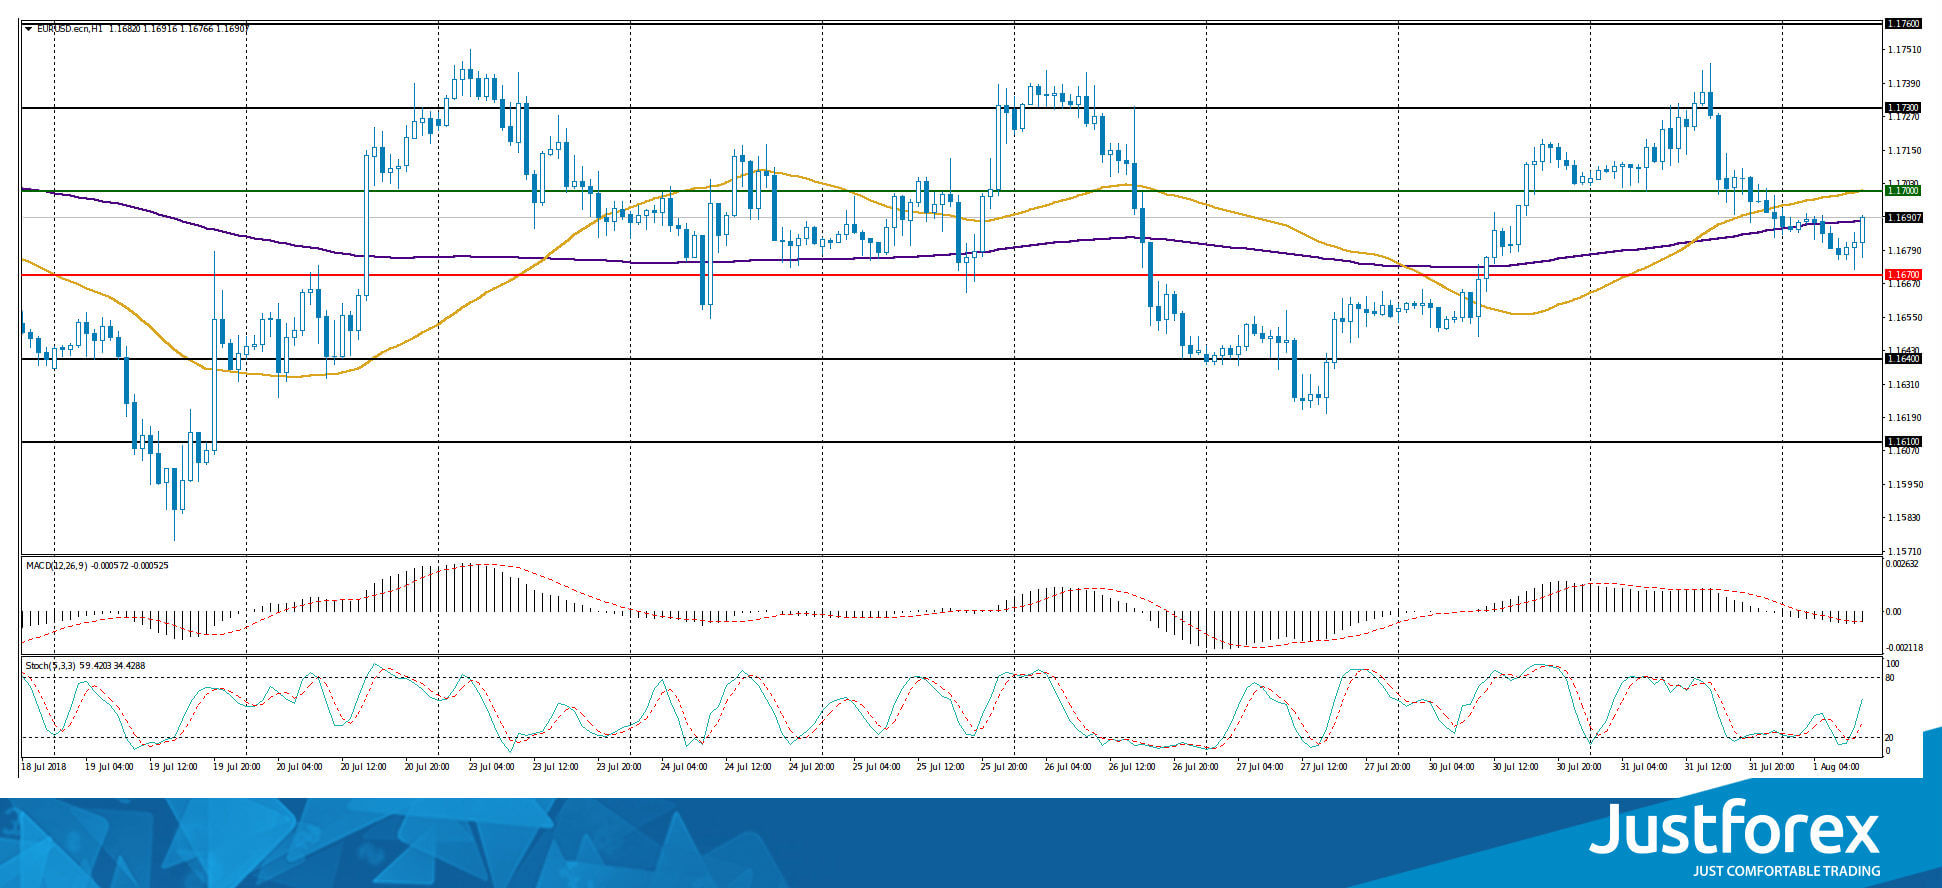
Indicators do not send accurate signals: the price is testing 200 MA.
The MACD histogram is in the negative zone, but above the signal line, which gives a weak signal to sell EUR/USD.
Stochastic Oscillator is in the neutral zone, the %K line is above the %D line, which indicates the growth of the currency pair.
Trading recommendations
Support levels: 1.16700, 1.16400, 1.16100
Resistance levels: 1.1700, 1.17300, 1.17600
If the price fixes below 1.16700, we recommend considering sales of EUR/USD. The movement is tending to 1.16400-1.16100.
Alternative option. If the price fixes above the already “mirror” resistance level of 1.17000, the EUR/USD quotes are expected to grow. The movement is tending to 1.17300-1.17600.
The GBP/USD currency pair
Technical indicators of the currency pair:
Prev Open: 1.31359
Open: 1.31179
% chg. over the last day: -0.11
Day’s range: 1.31083 – 1.31265
52 wk range: 1.2361 – 1.4345
Yesterday, there was a variety of trends on the GBP/USD currency pair. At the moment, the technical pattern is ambiguous. Local support and resistance levels are 1.30900 and 1.31300, respectively. The positions should be opened from these marks. We recommend paying attention to the news feed of the United Kingdom and the United States.
At 11:30 (GMT+3:00), the index of economic activity in the UK manufacturing sector will be published.
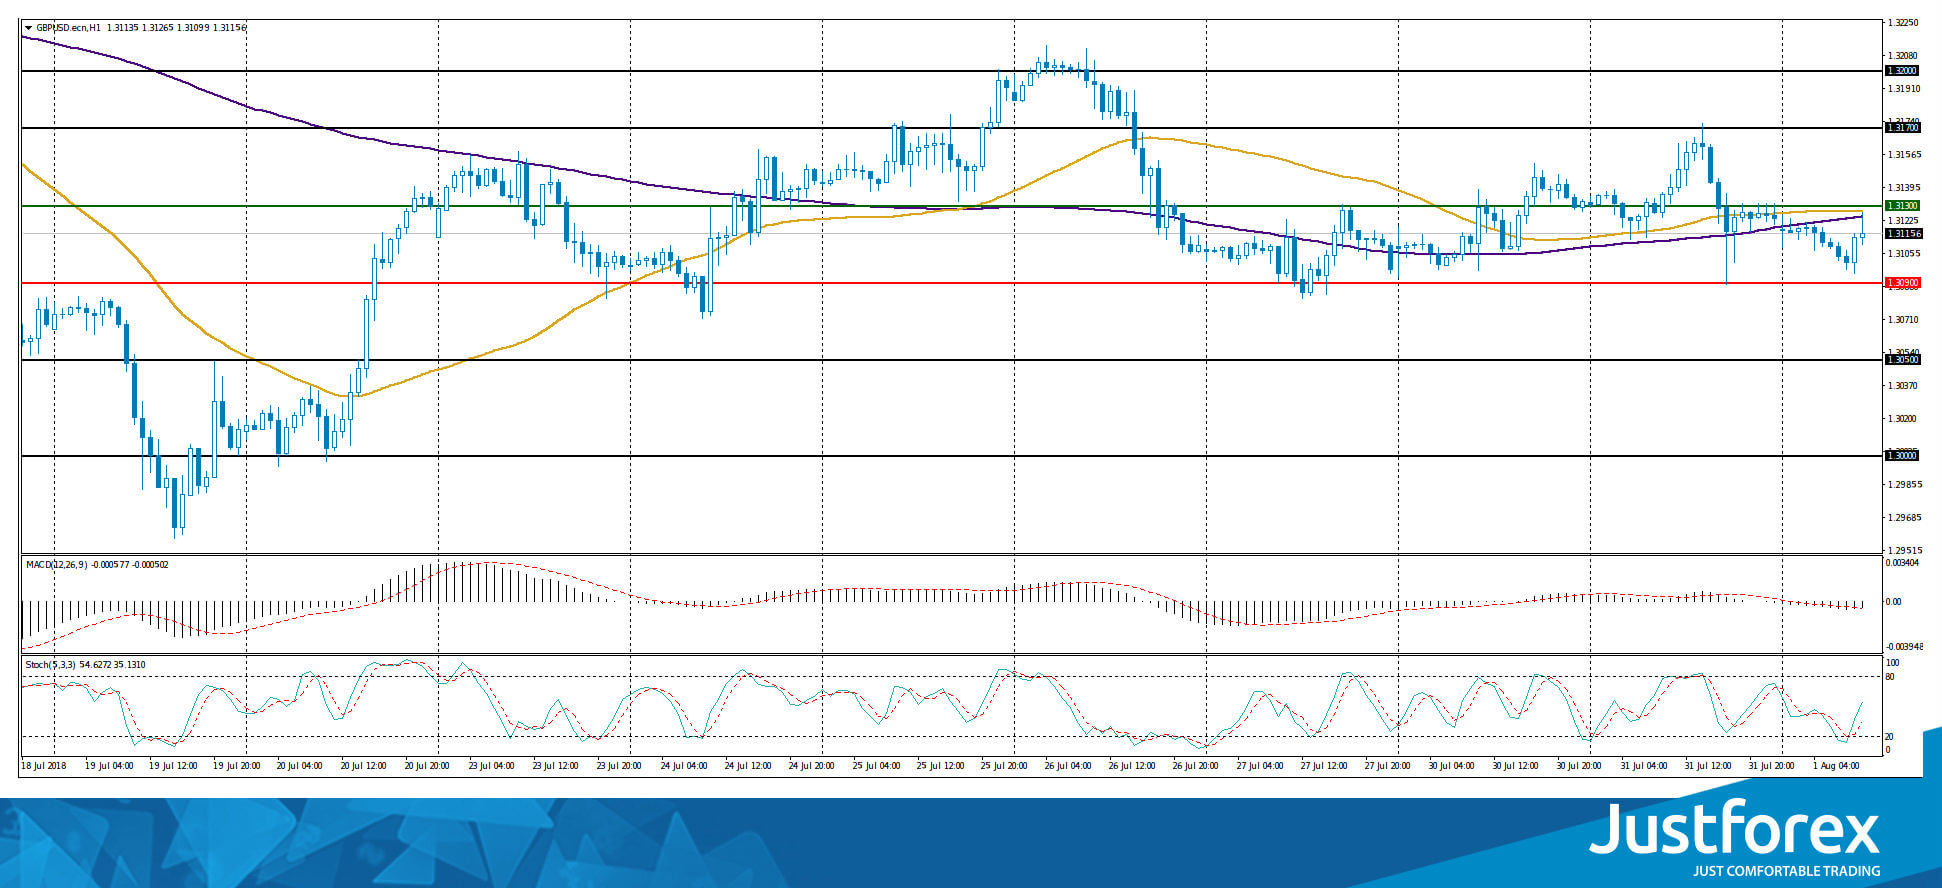
The price has fixed below 50 MA and 200 MA, which indicates the power of sellers.
The MACD histogram is in the negative zone, but above the signal line, which gives a weak signal to sell GBP/USD.
Stochastic Oscillator is located near the overbought zone, the %K line is above the %D line, which gives a signal to buy GBP/USD.
Trading recommendations
Support levels: 1.30900, 1.30500, 1.30000
Resistance levels: 1.31300, 1.31700, 1.32000
If the price fixes below 1.30900, we recommend looking for entry points to the market to open short positions. The movement is tending to 1.30500-1.30300.
Alternative option. If the price fixes above the resistance of 1.31300, the GBP/USD currency pair is expected to grow. The movement is tending to 1.31700-1.32000.
The USD/CAD currency pair
Technical indicators of the currency pair:
Prev Open: 1.30315
Open: 1.30117
% chg. over the last day: -0.13
Day’s range: 1.30152 – 1.30254
52 wk range: 1.2059 – 1.3795
During yesterday’s trading, the USD/CAD currency pair slightly weakened. The Canadian dollar was supported by positive statistics on Canada GDP. The indicator rose to 0.5% in May, although investors forecasted a value of 0.3%. At the moment, the technical pattern is ambiguous. Local support and resistance levels are 1.30000 and 1.30350, respectively. The positions should be opened from these marks. We recommend paying attention to the dynamics of oil quotes, as well as to economic statistics from the US.
The news feed on the economy of Canada is calm.
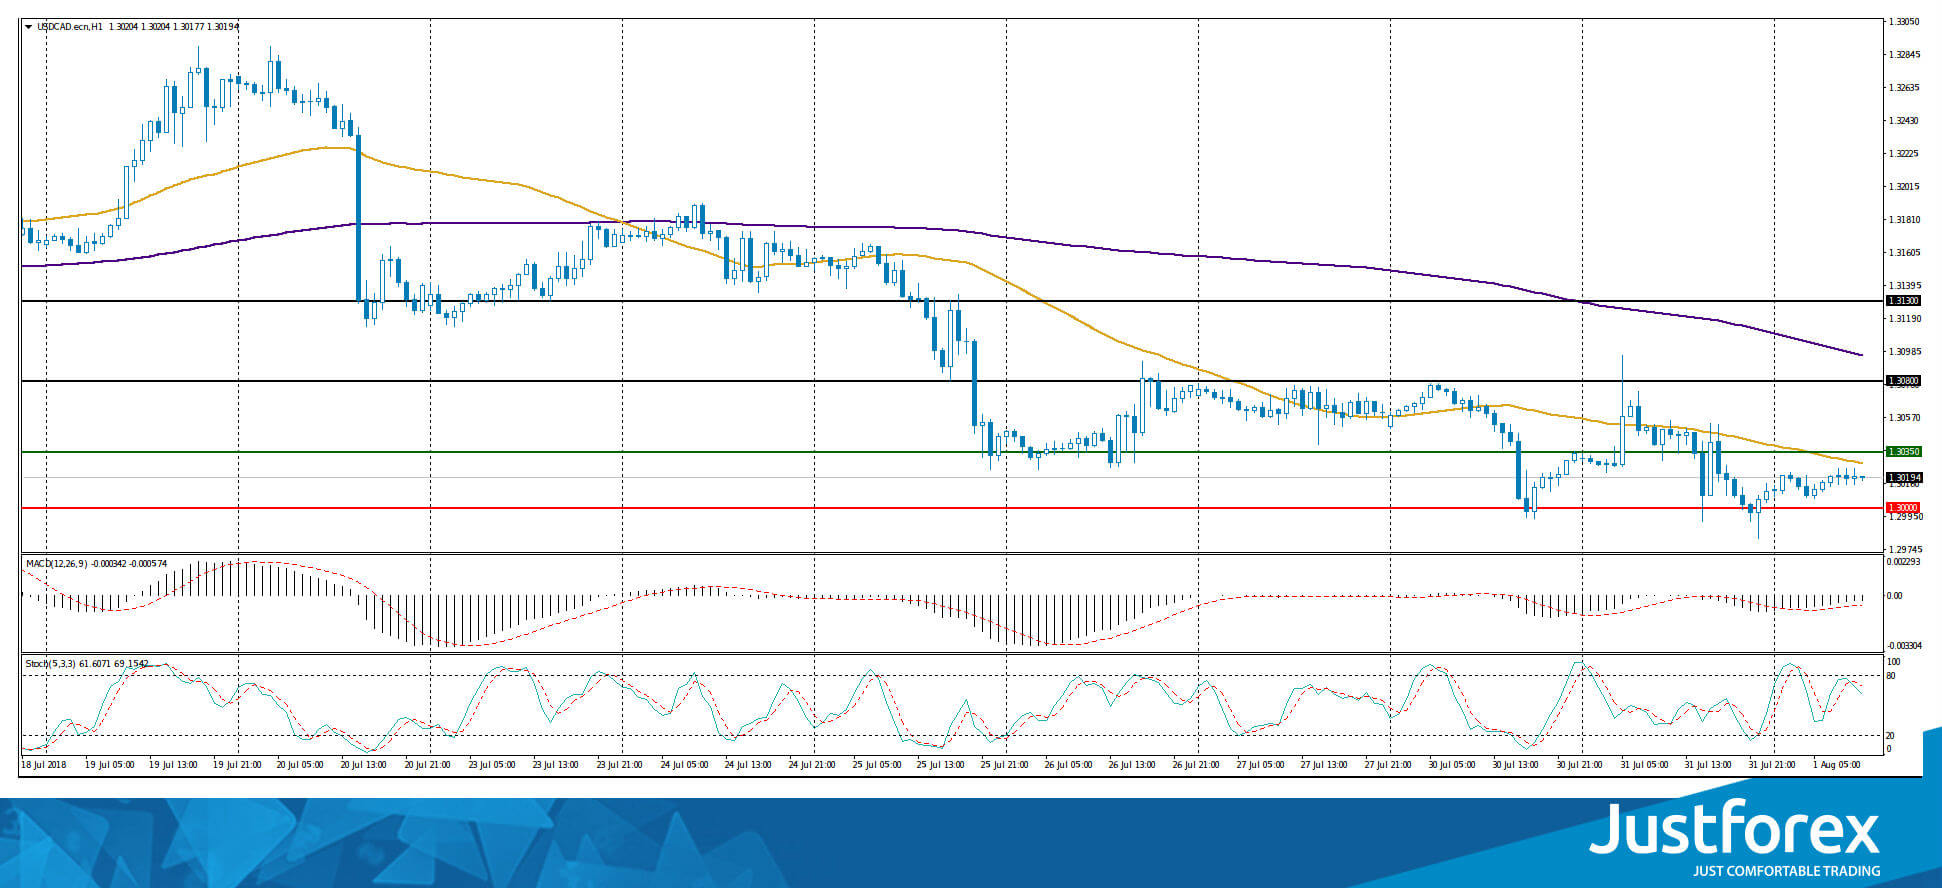
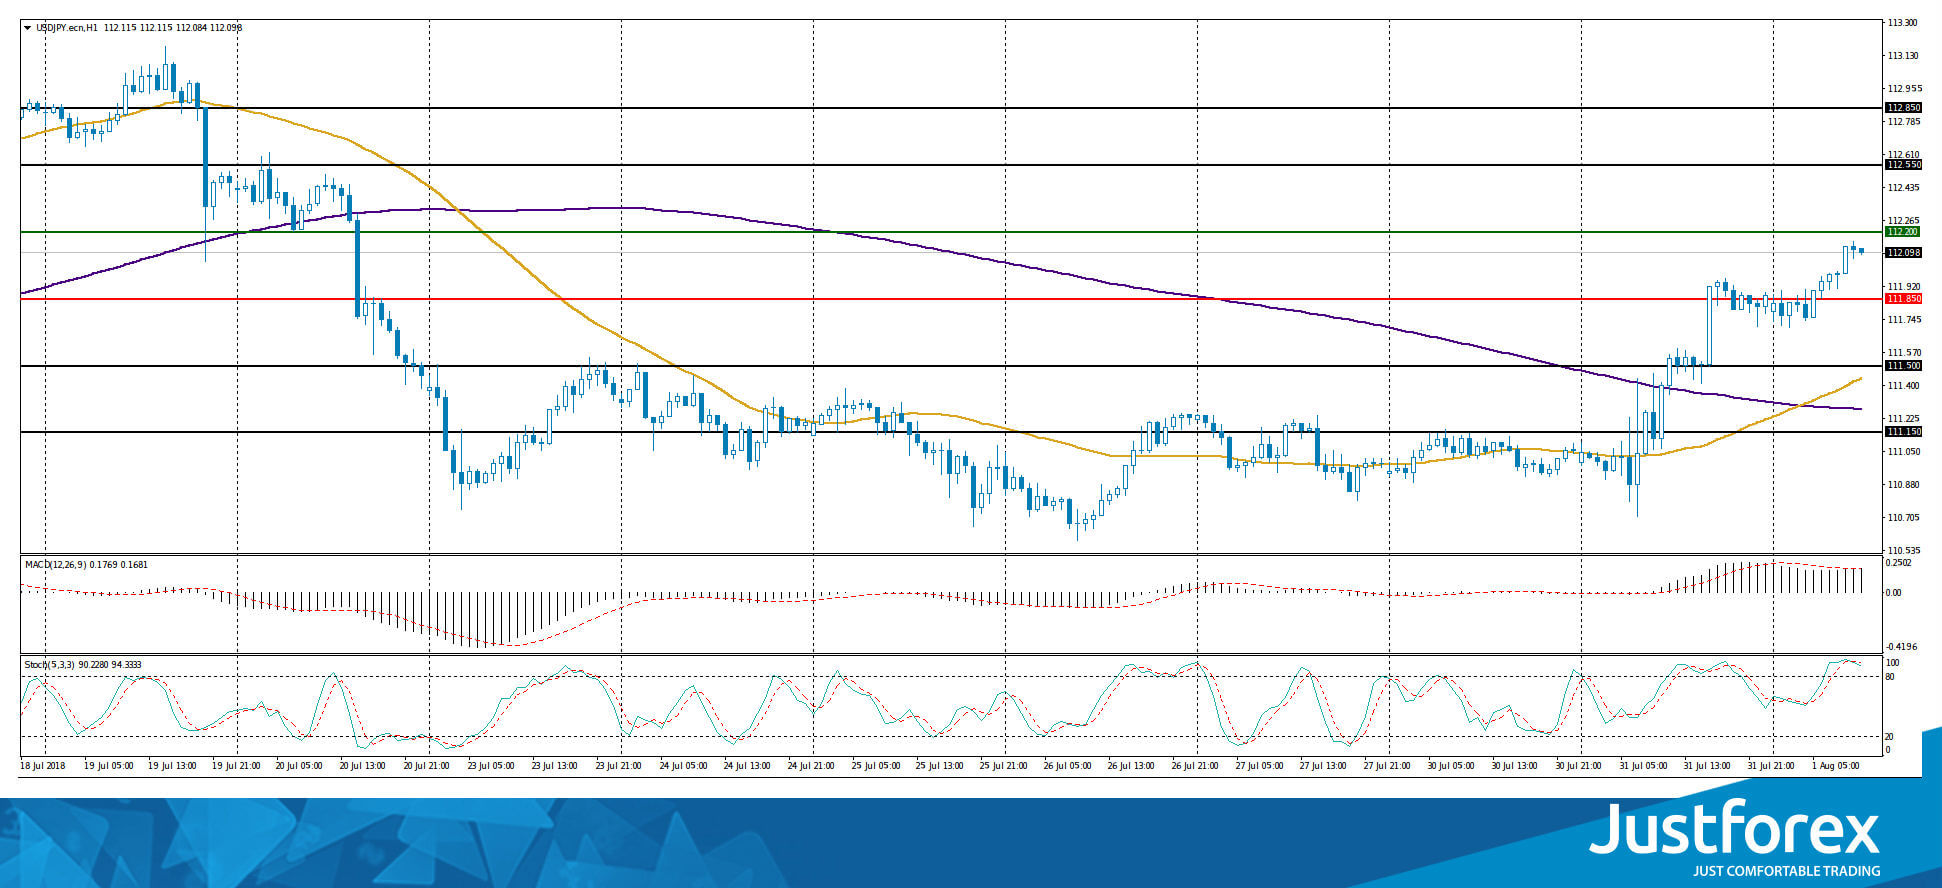
Indicators point to the power of buyers: the price has fixed above 50 MA and 200 MA.
The MACD histogram is in the positive zone, but below the signal line, which gives a weak signal to buy USD/JPY.
Stochastic Oscillator is located in the overbought zone, the %K line has crossed the %D line. There are no accurate signals.
Trading recommendations
Support levels: 111.850, 111.500, 111.150
Resistance levels: 112.200, 112.550, 112.850
If the price fixes above the resistance level of 112.200, further growth of the USD/JPY quotes is expected. The movement is tending to 112.550-112.850.
Alternative option. If the price fixes below the level of 111.850, we recommend considering sales of USD/JPY. The movement is tending to 111.500-111.150.


