The EUR/USD is in a downtrend but the pair has been ranging last few days. At this point we see a possible retracement to 1.1615-40, close to historical sellers. A rejection from the POC zone should target 1.1516. However a bounce from 1.1670 should make a bullish u-turn towards 1.1700 and 1.1750.
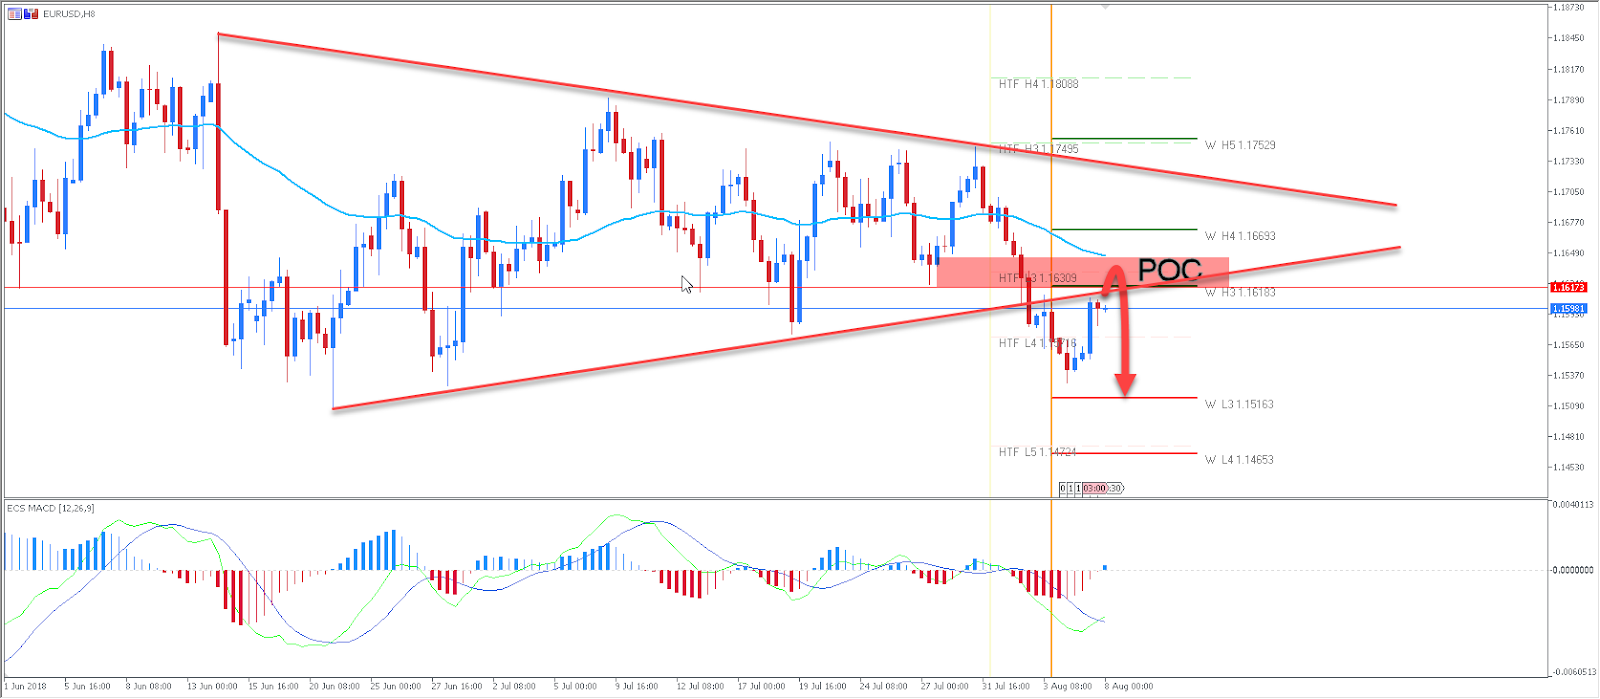
W L3 – Weekly Camarilla Pivot (Weekly Interim Support)
W H3 – Weekly Camarilla Pivot (Weekly Interim Resistance)
W H4 – Weekly Camarilla Pivot (Strong Weekly Resistance)
D H4 – Daily Camarilla Pivot (Very Strong Daily Resistance)
D L3 – Daily Camarilla Pivot (Daily Support)
D L4 – Daily H4 Camarilla (Very Strong Daily Support)
POC – Point Of Confluence (The zone where we expect price to react aka entry zone)