
The EUR/USD currency pair
Technical indicators of the currency pair:
Prev Open: 1.15703
Open: 1.15938
% chg. over the last day: +0.12
Day’s range: 1.15591 – 1.15744
52 wk range: 1.0571 – 1.2557
The technical pattern on the EUR/USD currency pair is ambiguous. Quotes are in a sideways trend. Investors assess the FOMC minutes. At the moment, the key support and resistance levels are 1.15400 and 1.15800, respectively. We recommend opening positions from these marks.
The news feed on 2018.08.23:
Data on economic activity in Germany and the Eurozone at 10:30 (GMT+3:00) and 11:00 (GMT+3:00);
Publication of the ECB account of monetary policy meeting at 14:30 (GMT+3:00);
New home sales in the US at 17:00 (GMT+3:00).
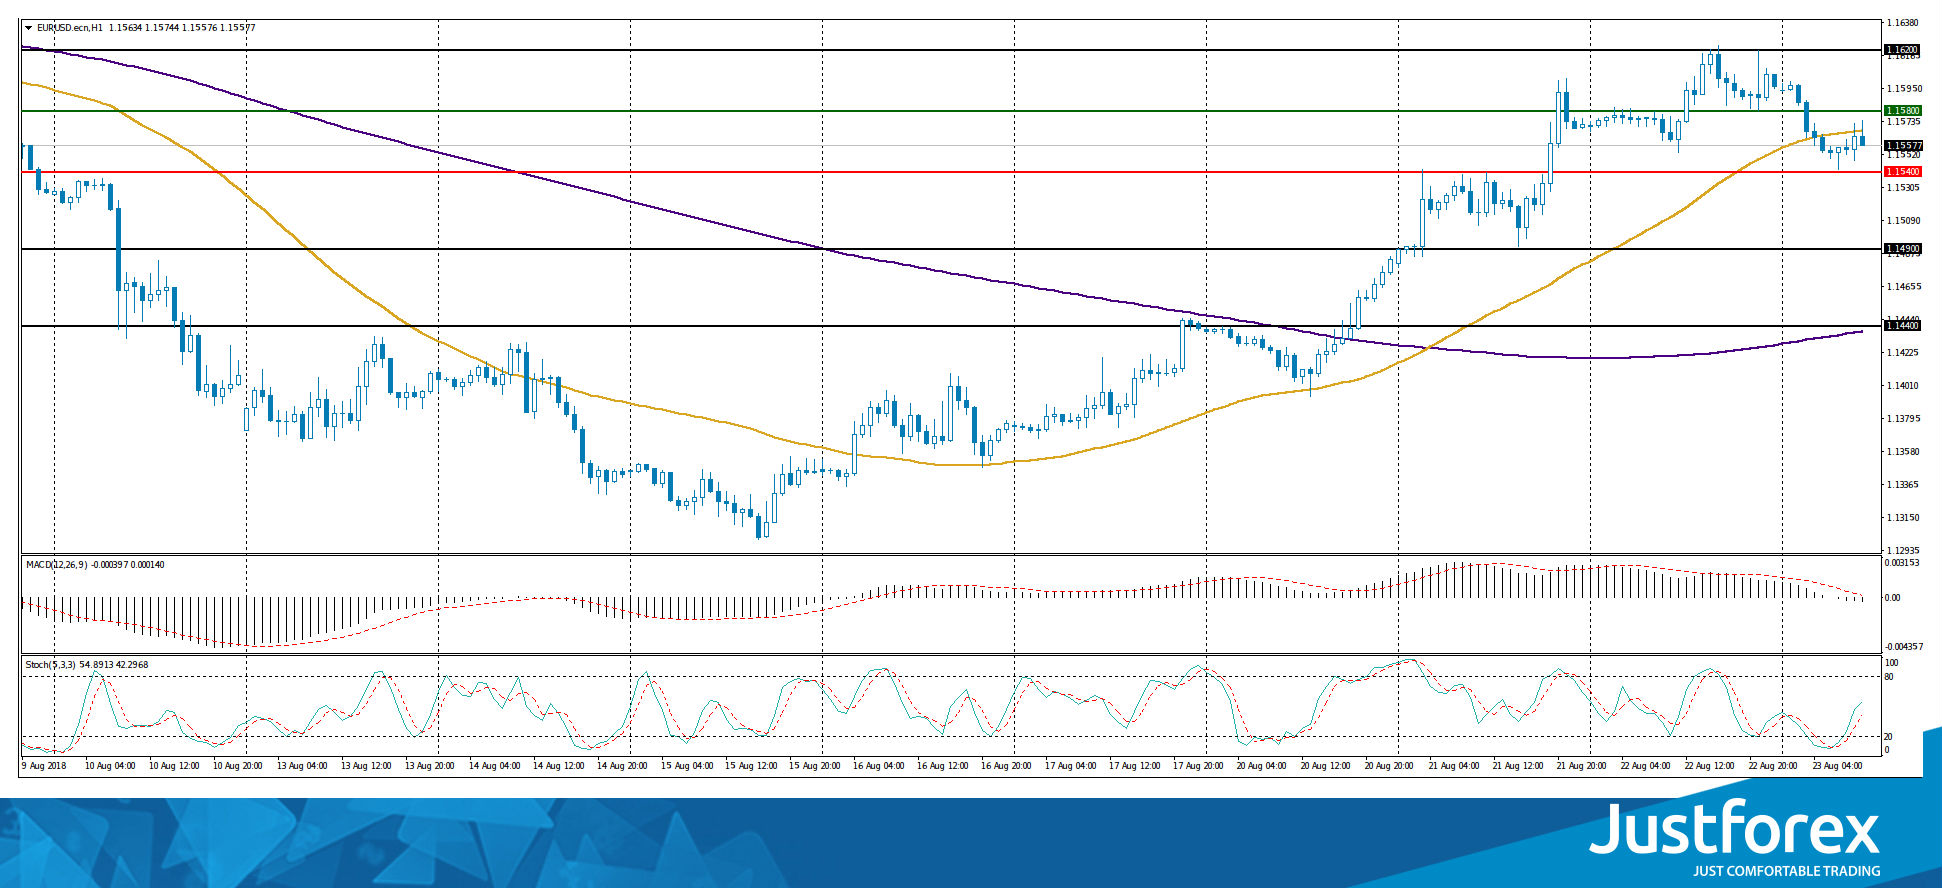
Indicators do not send accurate signals: the price is testing 50 MA.
The MACD histogram is located near the 0 mark.
Stochastic Oscillator is in the neutral zone, the %K line is above the %D line, which indicates the EUR/USD quotes growth.
Trading recommendations
Support levels: 1.15400, 1.14900, 1.14400
Resistance levels: 1.15800, 1.16200
If the price fixes above the resistance level of 1.15800, the growth of the EUR/USD currency pair is expected. The movement is tending to 1.16200-1.16500.
Alternative option. If the price fixes below 1.15400, we recommend considering sales of EUR/USD. The movement is tending to 1.14900-1.14700.
The GBP/USD currency pair
Technical indicators of the currency pair:
Prev Open: 1.28750
Open: 1.29006
% chg. over the last day: +0.03
Day’s range: 1.28741 – 1.28831
52 wk range: 1.2361 – 1.4345
There is a variety of trends on the GBP/USD currency pair. Financial market participants expect additional drivers. At the moment, the local support and resistance levels are 1.28600 and 1.28900, respectively. The positions should be opened from these marks.
The news feed on the UK economy is calm.
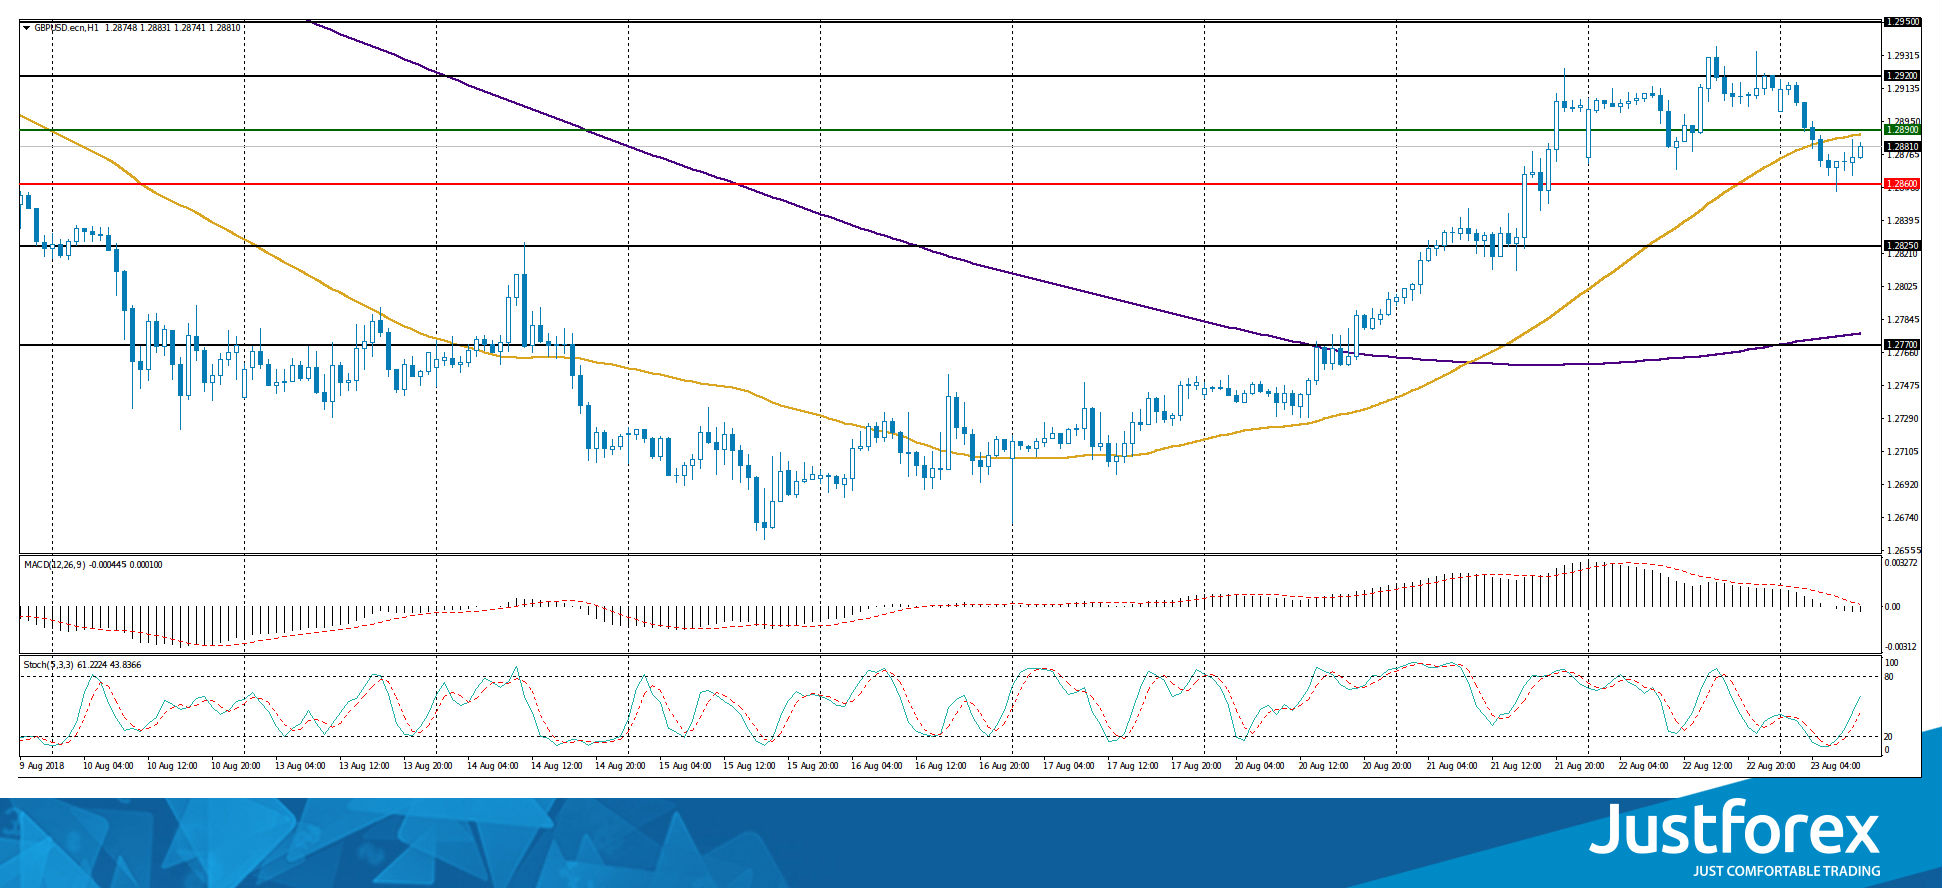
Indicators do not send accurate signals: the price is being traded between 50 MA and 200 MA.
The MACD histogram has moved to the negative zone, which indicates a decrease in the GBP/USD quotes.
Stochastic Oscillator is located in the neutral zone, the %K line is above the %D line, which signals to buy GBP/USD.
Trading recommendations
Support levels: 1.28600, 1.28250, 1.27700
Resistance levels: 1.28900, 1.29200, 1.29500
If the price fixes above 1.28900, the GBP/USD currency pair is expected to grow. The target movement level is 1.29200-1.29500.
Alternative option. If the price fixes below 1.28600, we recommend considering sales of GBP/USD. The target movement level is 1.28250-1.28000.
The USD/CAD currency pair
Technical indicators of the currency pair:
Prev Open: 1.30367
Open: 1.29893
% chg. over the last day: -0.21
Day’s range: 1.30334 – 1.30458
52 wk range: 1.2059 – 1.3795
Yesterday, the bearish sentiment was observed on the USD/CAD currency pair. However, today quotes are recovering. At the moment, the local support and resistance levels are 1.30250 and 1.30500, respectively. We recommend opening positions from these marks. The trading instrument has the potential for further growth.
The news feed on the economy of Canada is calm.
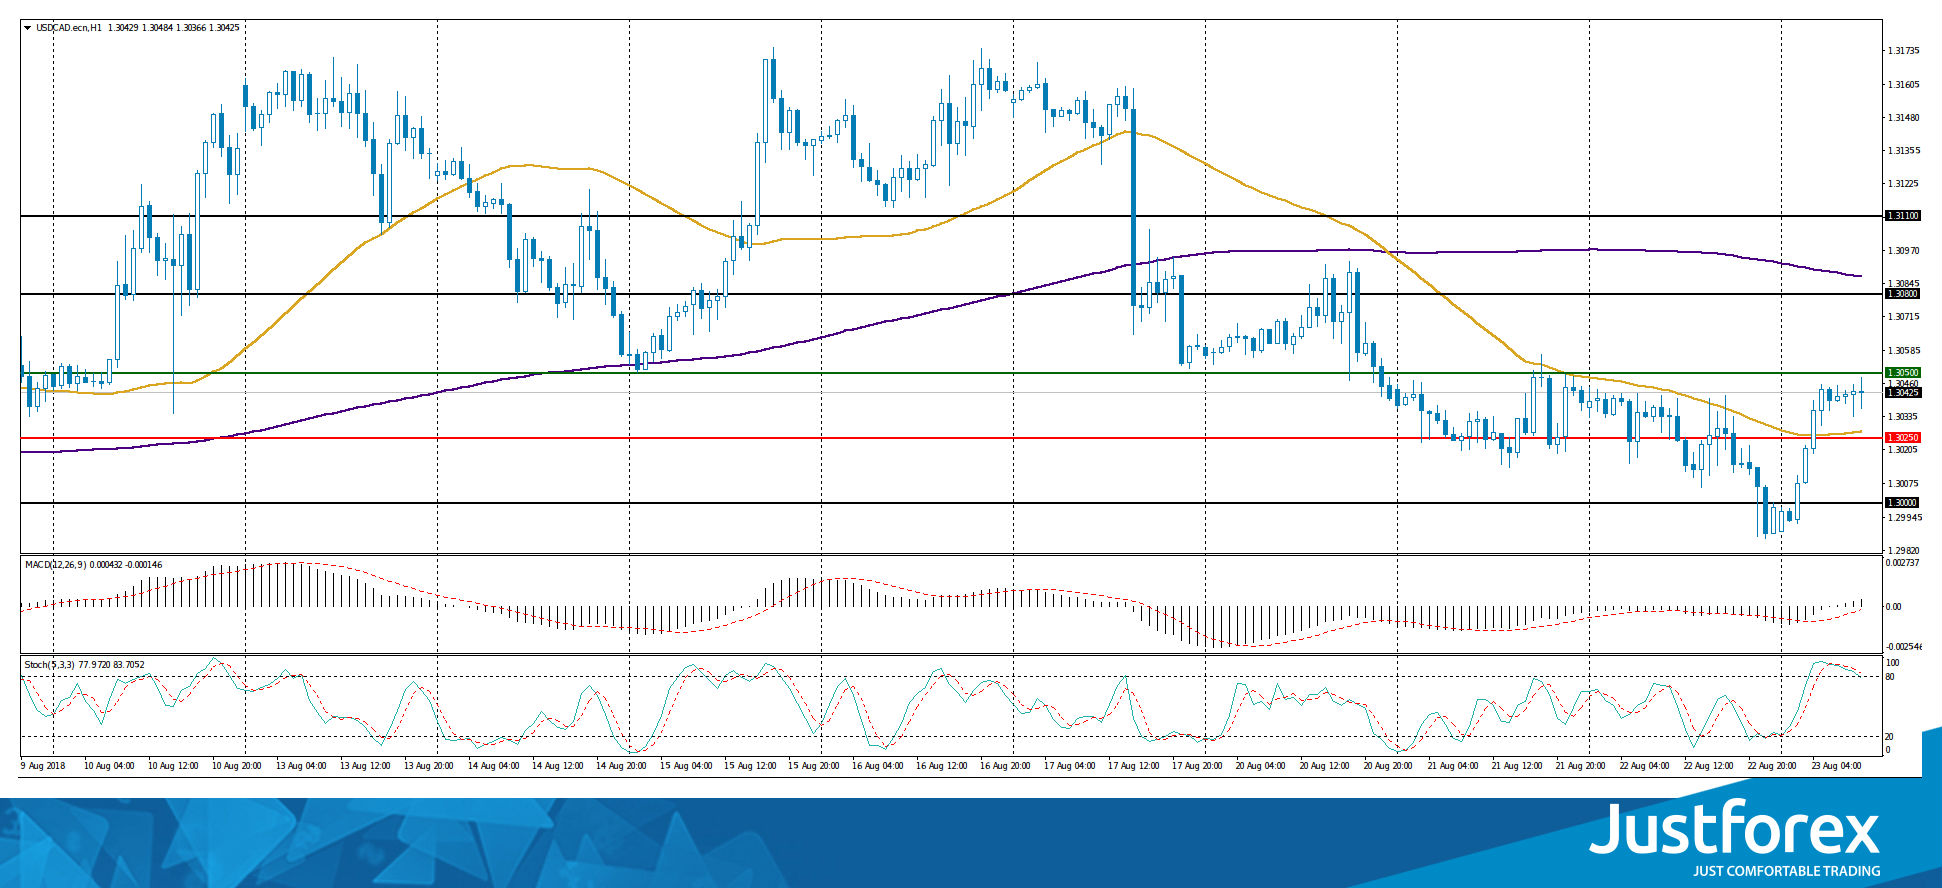
The price has fixed between 50 MA and 200 MA, which are strong dynamic support and resistance levels.
The MACD histogram has moved to the positive zone, which indicates the USD/CAD quotes growth.
Stochastic Oscillator is located in the overbought zone, the %K line is below the %D line, which gives a signal to sell USD/CAD.
Trading recommendations
Support levels: 1.30250, 1.30000
Resistance levels: 1.30500, 1.30800, 1.31100
If the price fixes below 1.30250, the USD/CAD quotes are expected to decline. The movement is tending to 1.30000-1.29800.
Alternative option. If the price fixes above the resistance of 1.30500, it is necessary to consider purchases of USD/CAD. The movement is tending to 1.30800-1.31100.
The USD/JPY currency pair
Technical indicators of the currency pair:
Prev Open: 110.231
Open: 110.549
% chg. over the last day: +0.25
Day`s range: 110.787 – 110.882
52 wk range: 104.56 – 114.74
There is the bullish sentiment on the USD/JPY currency pair. During yesterday’s and today’s trading sessions, quotes have risen by more than 80 points. At the moment, quotes are testing the local resistance level of 110.900. Local support is the level of 110.700. The positions should be opened from these marks.
The news feed on the economy of Japan is calm.
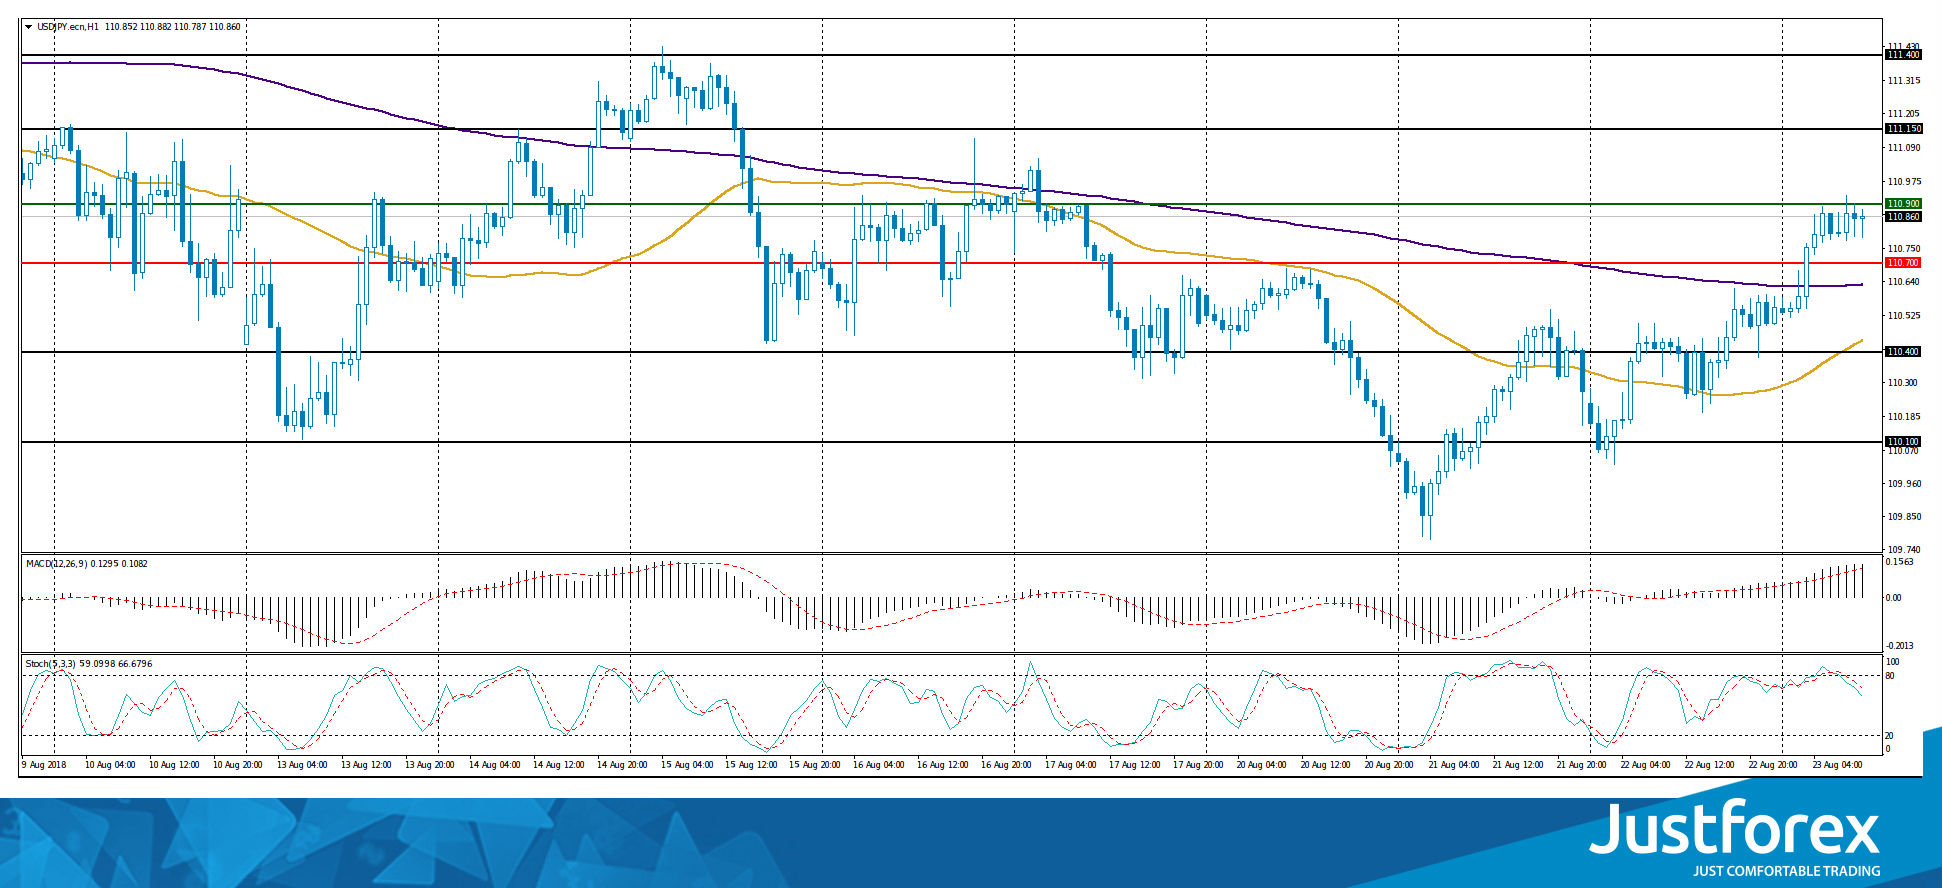
Indicators point to the power of buyers: the price is above 50 MA and 200 MA.
The MACD histogram is in the positive zone, above the signal line, which gives a strong signal to buy USD/JPY.
Stochastic Oscillator is located in the neutral zone, the %K line is below the %D line, which indicates a decrease in quotes.
Trading recommendations
Support levels: 110.700, 110.400, 110.100
Resistance levels: 110.900, 111.150, 111.400
If the price fixes above the resistance level of 110.900, the growth of the USD/JPY currency pair is expected. The movement is tending to 111.150-111.400.
Alternative option. If the price fixes below the 110.700 mark, it is necessary to consider sales of USD/JPY. The movement is tending to 110.400-110.100.


