Bears are taking the control back
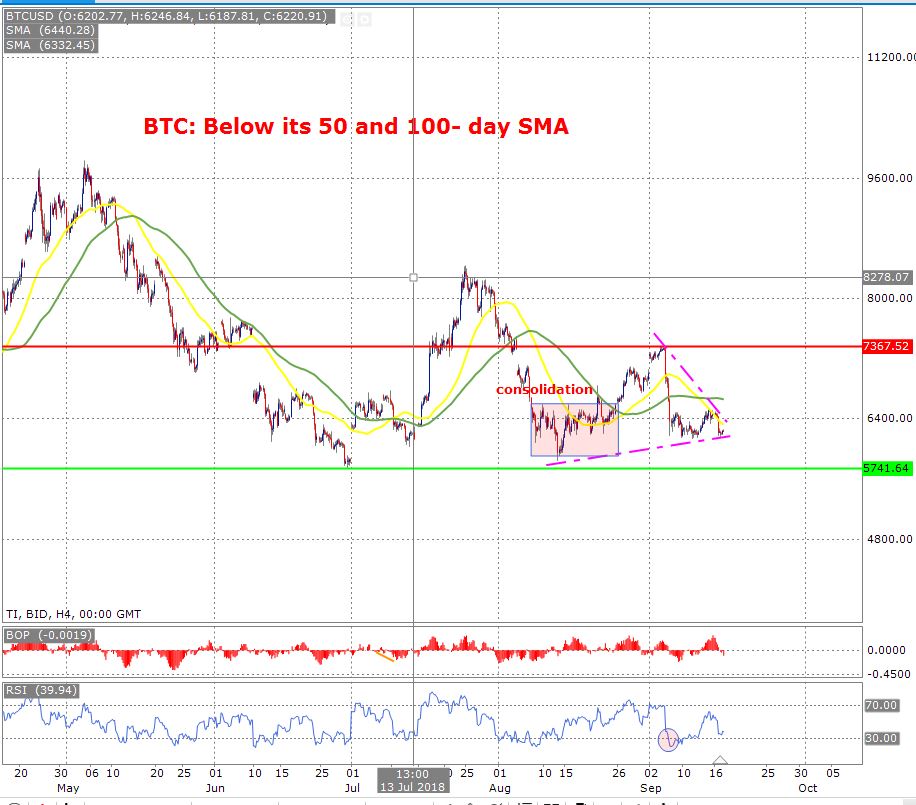
BTC is consolidating on an intraday time frame; 4-hour chart. This consolidation is taking place near the end of the symmetrical triangle pattern. These patterns usually break in the direction of the trend. By looking at the chart, one can say that there is no clear trend because the price has been moving in a sideway pattern and the range is $9600 to $5741.
However, when we compare this to the 50 and 100-day moving averages, then it becomes more prominent that the trend that we have is skewed to the downside. The 50-day moving average is shown in the yellow colour and the 100-day moving average is shown in green colour. The 50-day moving average is trading below the 100-day moving average which is another sign which confirms that the trend is biased- bears are in control of the price.
The Balance of Power shows that the bulls have lost control and bears are taking control. The RSI is trading above the upward trend line and as long as it stays above this, the bulls may be able to fight their way up
The support line is shown in bright green colour and it is the lowest point from 29-July. The resistance is shown by the red line and this is the highest high formed on the 5th of September.