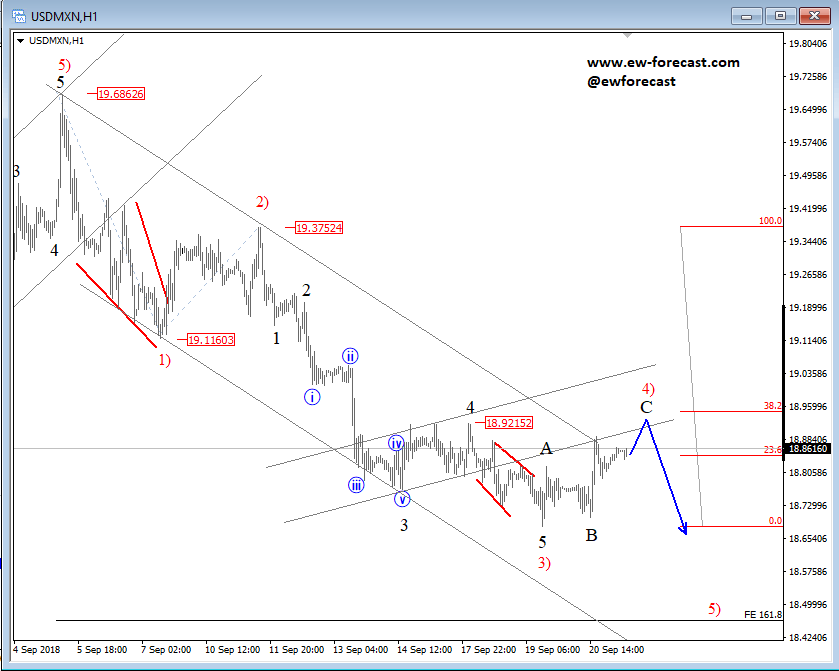
On intra-day chart of USDMXN we see price trading within a bearish price movement, down from 19.6863 level which looks to be a clean impulse in progress.
An impulse is structured by five sub-waves with a 5-3-5-3-5 form and moves in the direction of a stronger trend. An impulse is also the most common motive wave in Elliott wave terminology, and the other one less common is the diagonal triangle which we won’t be discussing today.
We are specifically observing a recently completed leg 3) which is also known as the strongest leg within an impulse, which is now being followed by a temporary turn up from the lows labelled as a temporary correction. This correction is wave 4), usully a complex pullback that can look for resistance and a bearish turn into wave 5) near the 18.920-19.100 level. That said, a strong drop in five minor legs and a break below the 18.60 level will confirm an ongoing wave 5) that can aim for the 18.50 region.
USDMXN, 1h