
The EUR/USD currency pair
Technical indicators of the currency pair:
Prev Open: 1.17764
Open: 1.17401
% chg. over the last day: -0.23
Day’s range: 1.17368 – 1.17523
52 wk range: 1.0571 – 1.2557
On Friday, the EUR/USD currency pair moved away from local highs. At the moment, the technical pattern is ambiguous. The EUR/USD quotes are testing local support and resistance levels: 1.17300 and 1.17700, respectively. The positions should be opened from these marks. The further growth of the EUR/USD currency pair is not excluded.
The news feed on 2018.09.24:
German Ifo business climate index at 11:00 (GMT+3:00).
We also recommend paying attention to the speech by the ECB president Draghi.
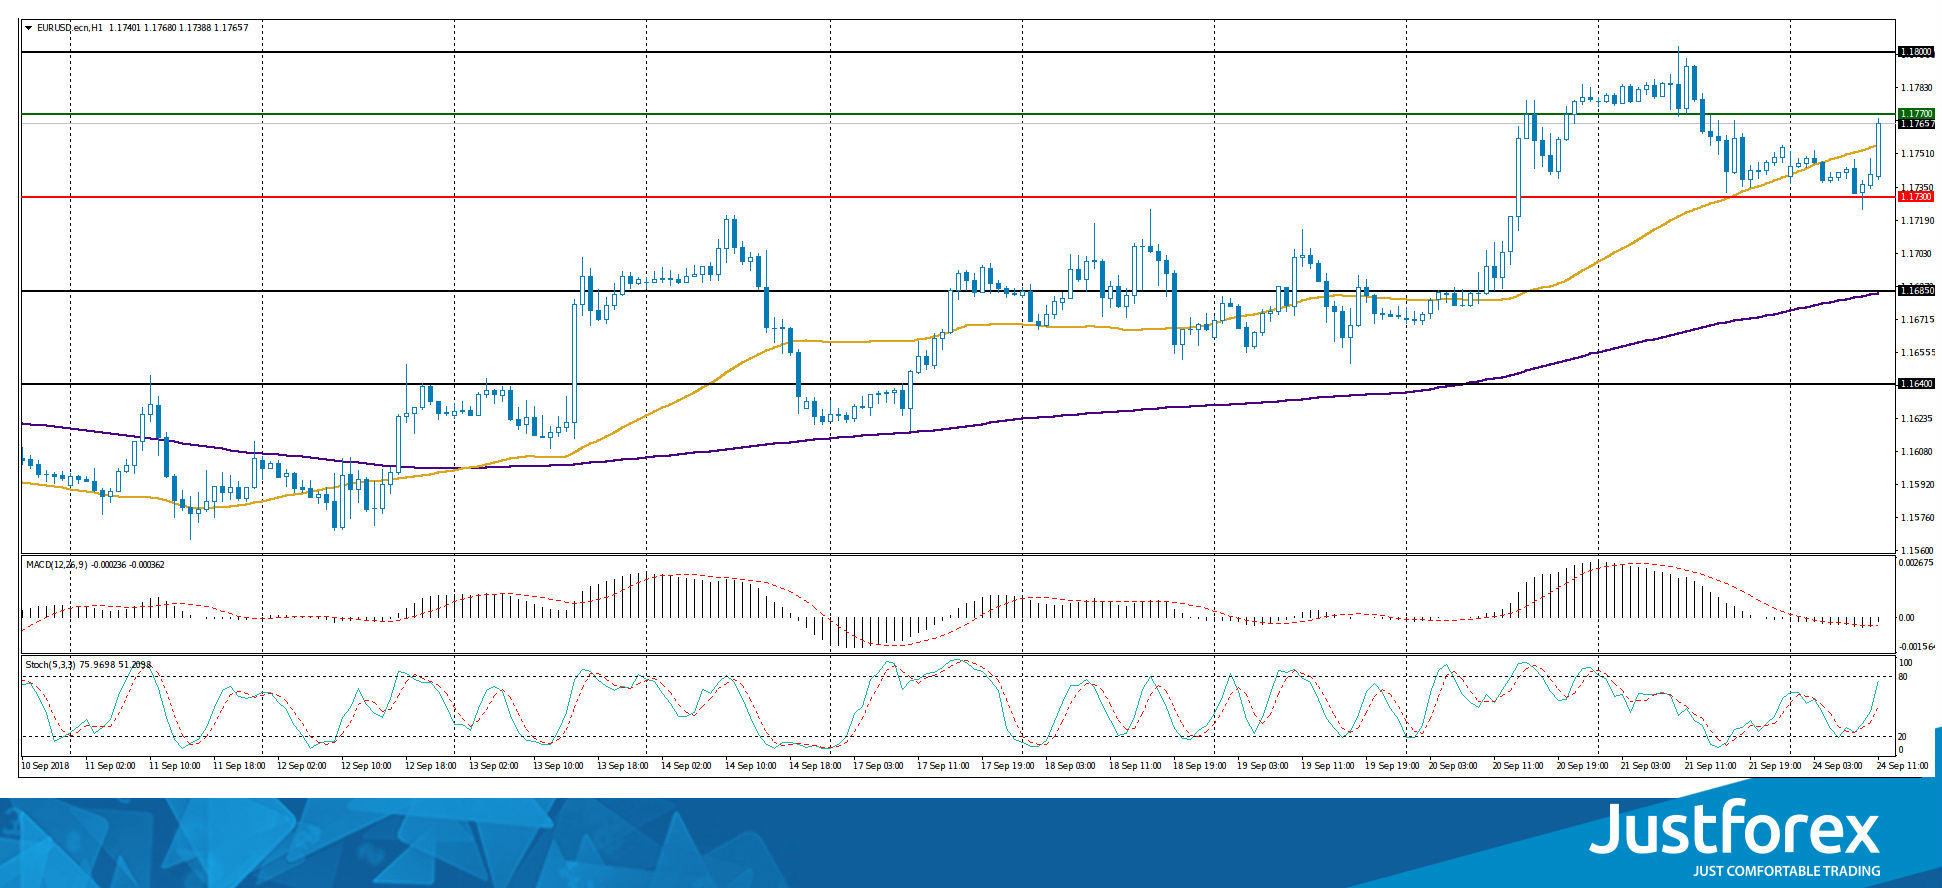
Indicators do not send accurate signals: the price has crossed 50 MA.
The MACD histogram is near 0 mark. There are no accurate signals.
Stochastic Oscillator is located in the neutral zone, the %K line is above the %D line, which indicates the growth of quotes.
Trading recommendations
Support levels: 1.17300, 1.16850, 1.16400
Resistance levels: 1.17700, 1.18000
If the price fixes above the resistance level of 1.17700, further growth of the EUR/USD quotes is expected. The movement is tending to 1.18000-1.18200.
An alternative may be the decrease of the EUR/USD currency pair to 1.16850-1.16400.
The GBP/USD currency pair
Technical indicators of the currency pair:
Prev Open: 1.32500
Open: 1.30749
% chg. over the last day: -1.43
Day’s range: 1.30963 – 1.31151
52 wk range: 1.2361 – 1.4345
On Friday, aggressive sales were observed on the GBP/USD currency pair. The decrease in quotes exceeded 175 points. The British pound weakened significantly against the US dollar after Theresa May stated that Brexit negotiations were at an impasse. At the moment, the key trading range is 1.30700-1.31300. The positions should be opened from these marks.
Today, the news feed on the UK economy is calm.
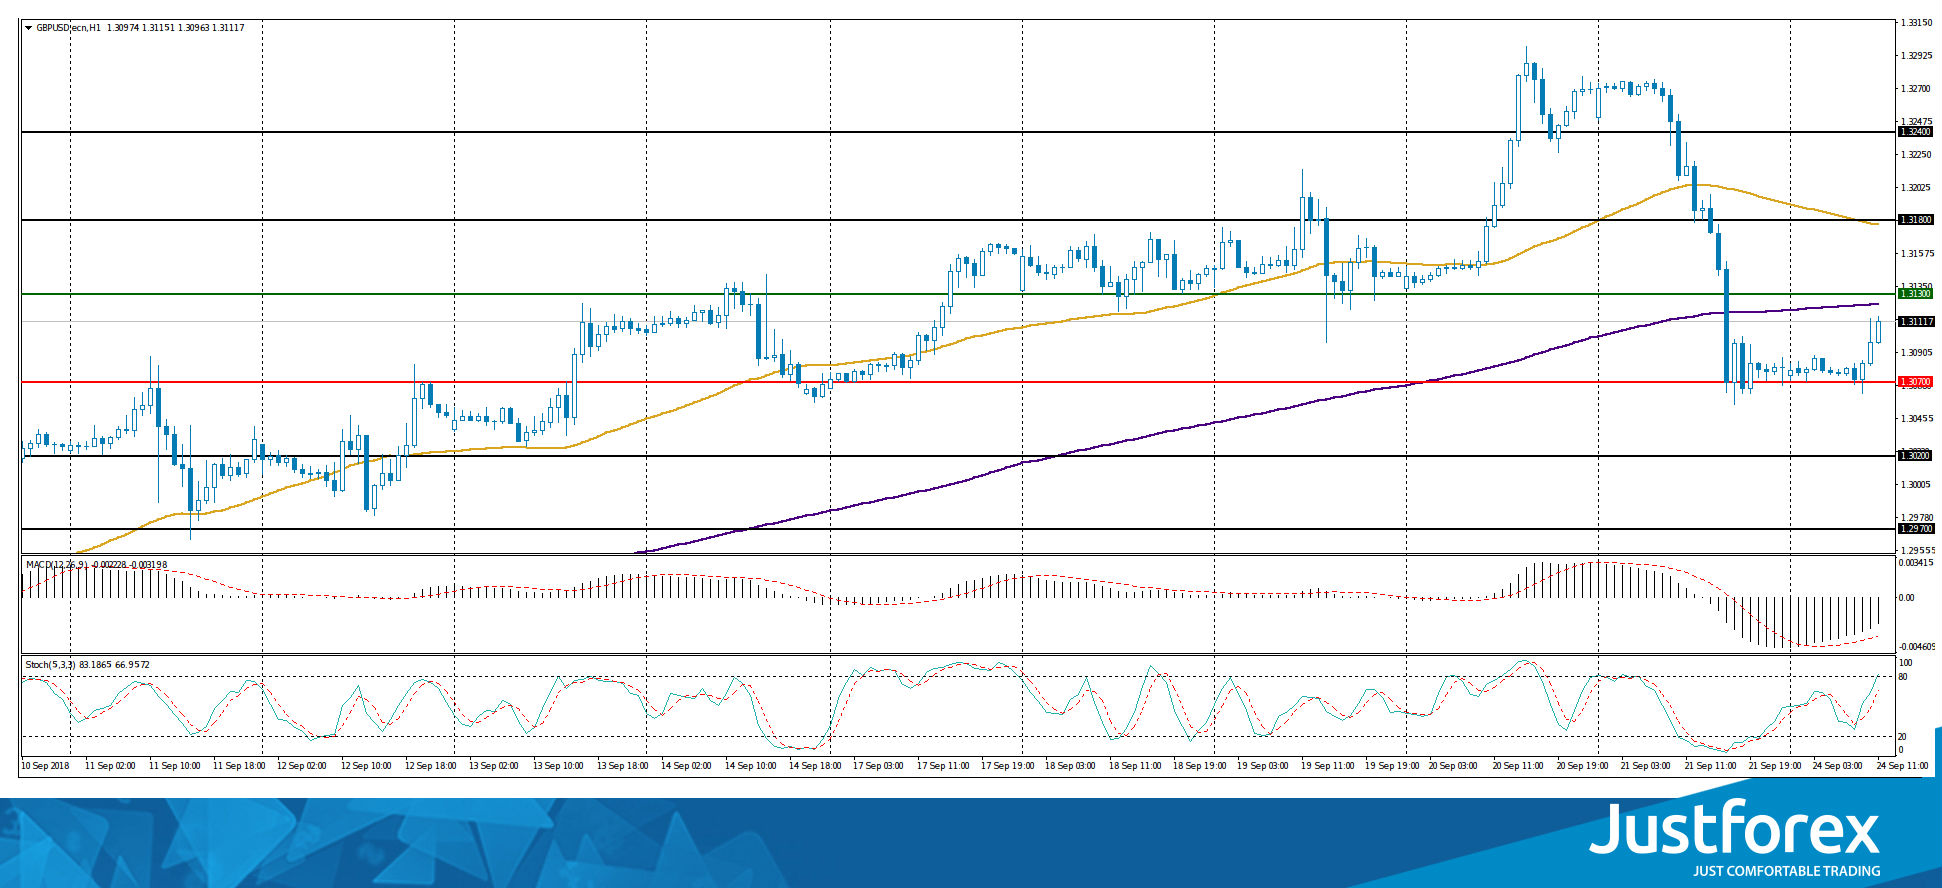
The price has fixed below 50 MA and 200 MA, which signals the power of sellers.
The MACD histogram is located in the negative zone, but above the signal line, which gives a weak signal to sell GBP/USD.
Stochastic Oscillator is in the neutral zone, the %K line is above the %D line, which indicates the bullish sentiment.
Trading recommendations
Support levels: 1.30700, 1.30200, 1.29700
Resistance levels: 1.31300, 1.31800, 1.32400
If the price fixes below the local support of 1.30700, further decline in the GBP/USD currency pair is expected. The movement is tending to 1.30200-1.30000.
An alternative may be the GBP/USD quotes growth to the local offer zone of 1.31800-1.32000.
The USD/CAD currency pair
Technical indicators of the currency pair:
Prev Open: 1.29042
Open: 1.29243
% chg. over the last day: +0.09
Day’s range: 1.29157 – 1.29276
52 wk range: 1.2059 – 1.3795
The USD/CAD quotes are still in a sideways trend. A unidirectional trend is not observed. According to report published on Friday, the core retail sales index in Canada rose to 0.9% in August instead of 0.6%. Local support and resistance levels are: 1.29150 and 1.29500, respectively. We recommend looking for entry points to the market from these marks.
The news feed on the economy of Canada is calm.
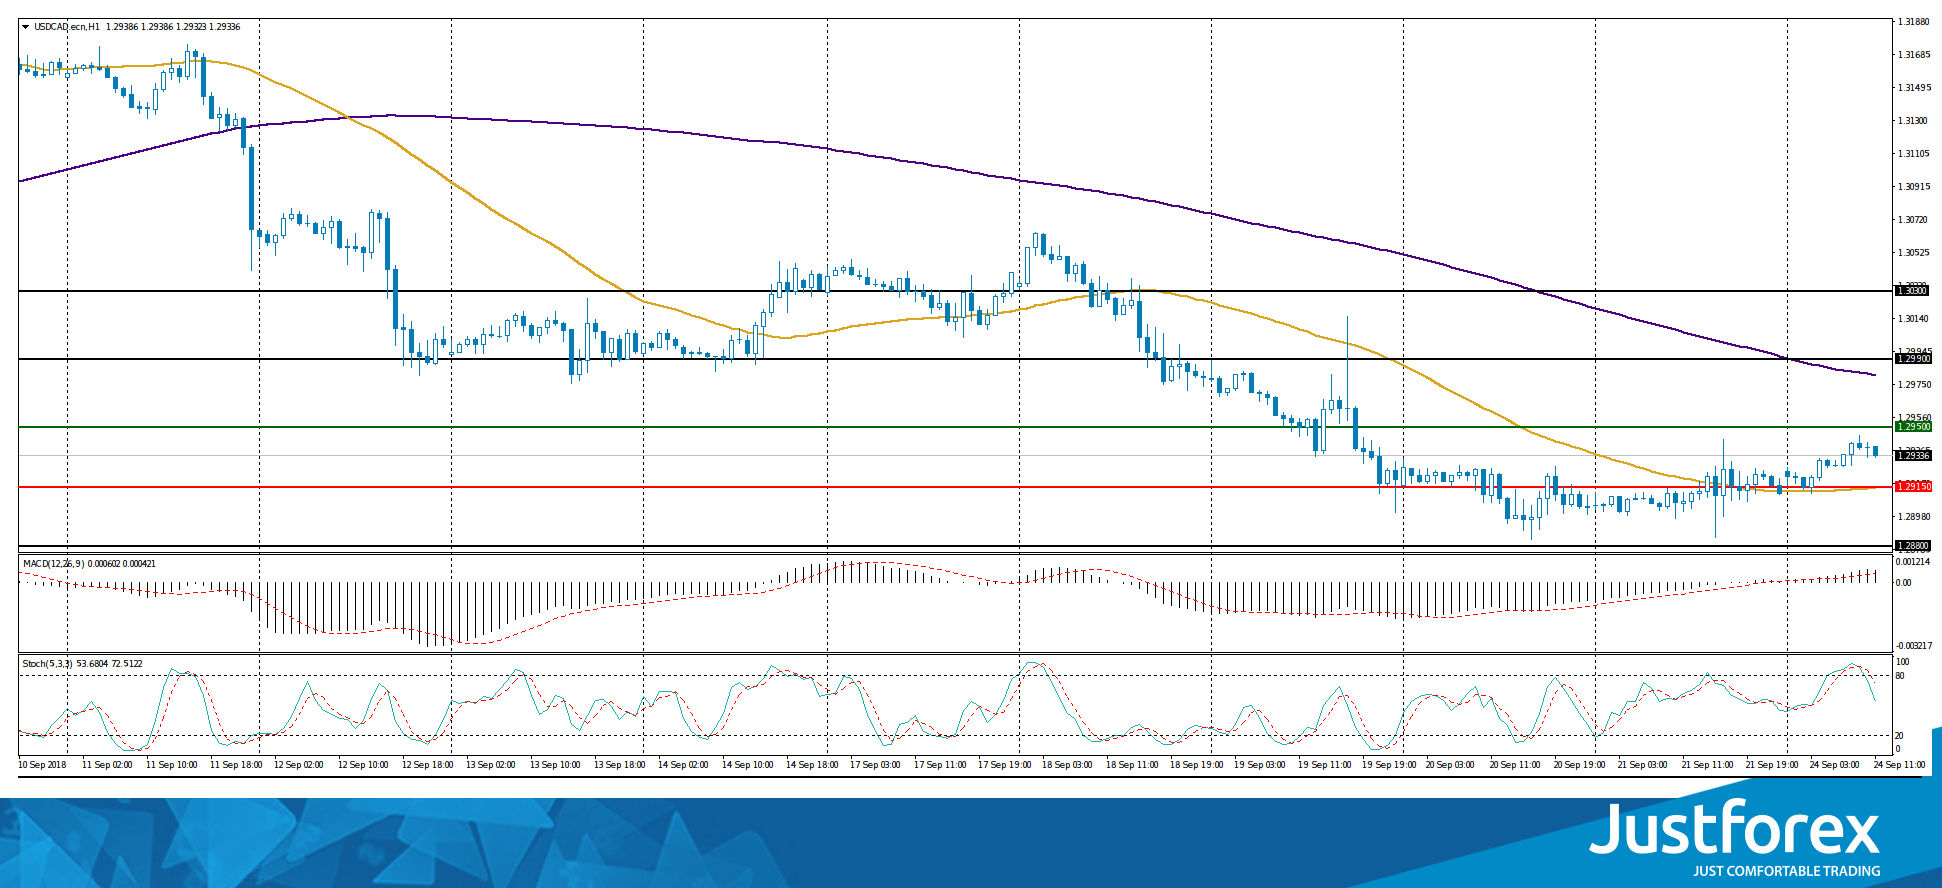
The price has fixed between 50 MA and 200 MA, which are dynamic support and resistance levels.
The MACD histogram is in the positive zone, above the signal line, which signals to buy USD/CAD.
Stochastic Oscillator is in the neutral zone, the %K line is below the %D line, which indicates the bearish sentiment.
Trading recommendations
Support levels: 1.29150, 1.28800
Resistance levels: 1.29500, 1.29900, 1.30300
If the price fixes below the local support of 1.29150, the USD/CAD quotes are expected to decline. The movement is tending to 1.28800-1.28500.
Alternative option. If the price fixes above 1.29500, it is necessary to consider purchases of USD/CAD. The target movement level is 1.29900-1.30300.
The USD/JPY currency pair
Technical indicators of the currency pair:
Prev Open: 112.440
Open: 112.422
% chg. over the last day: +0.07
Day’s range: 112.429 – 112.874
52 wk range: 104.56 – 114.74
The technical pattern on the USD/JPY currency pair is ambiguous. At the moment, quotes are consolidating. Local support and resistance levels are: 112.450 and 112.700. We recommend paying attention to the US government bonds yield. Positions should be opened from the key levels.
The news feed on the economy of Japan is calm today.
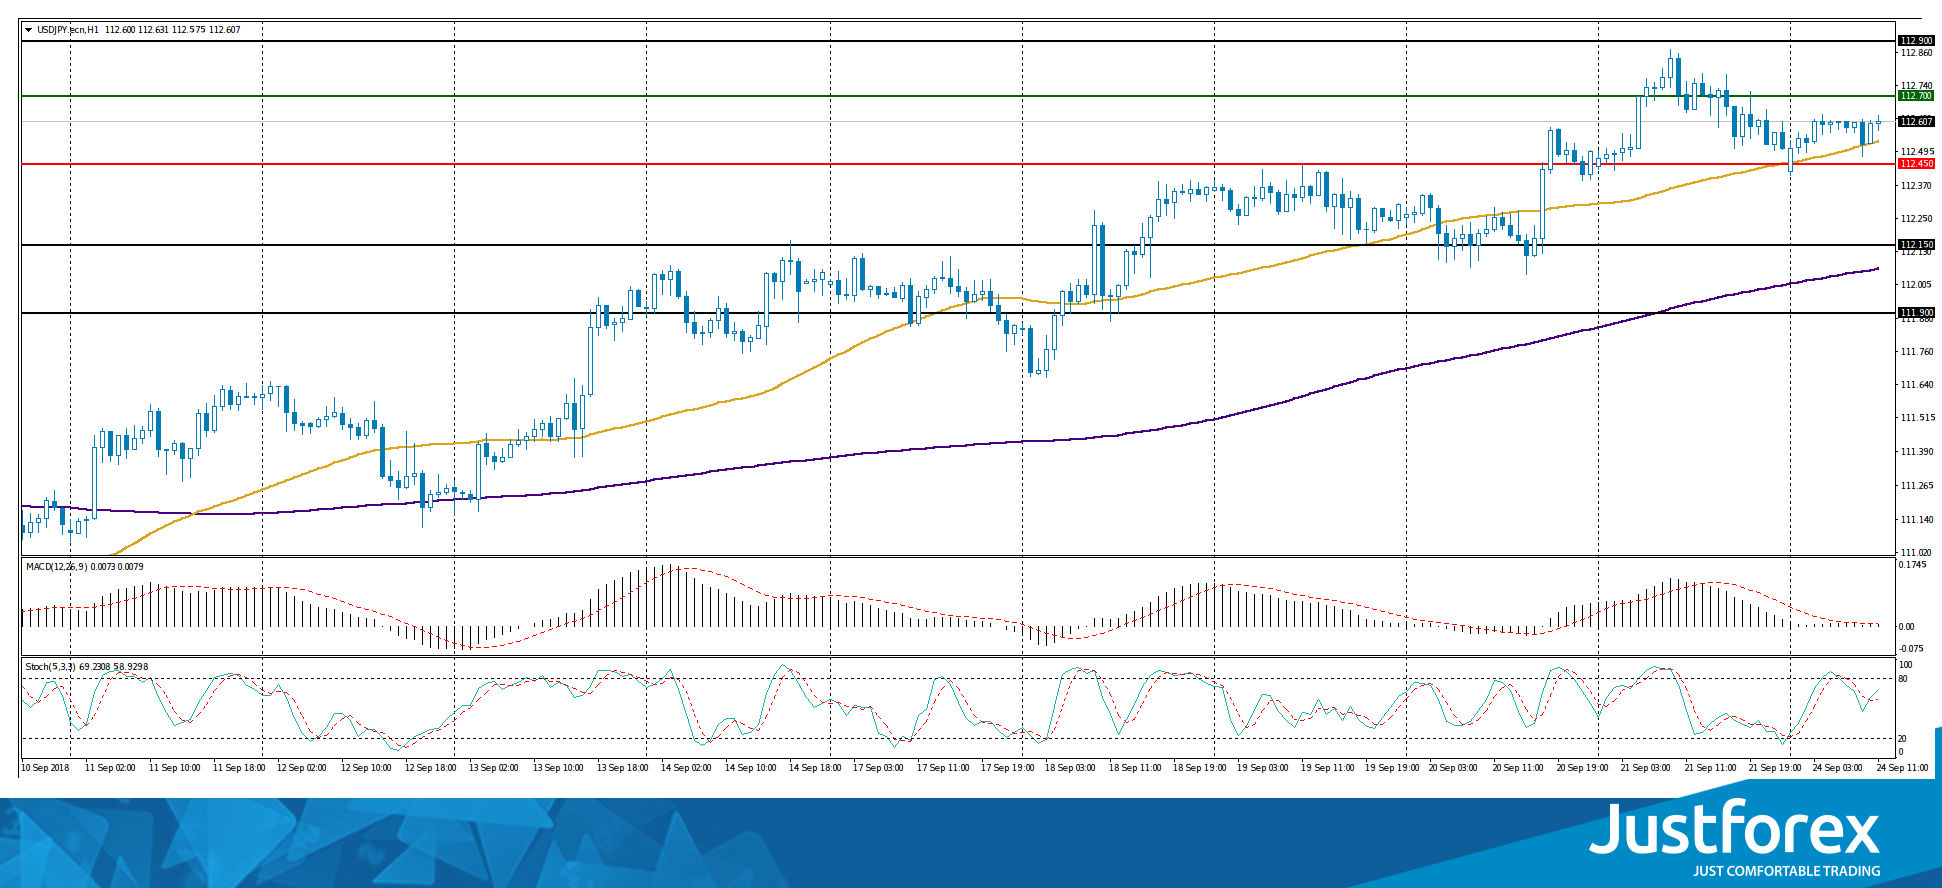
The price has fixed above 50 MA and 200 MA, which signals the power of buyers.
The MACD histogram is located near the 0 mark. There are no signals.
Stochastic Oscillator is in the neutral zone, the %K line has crossed the %D line. There are no accurate signals.
Trading recommendations
Support levels: 112.450, 112.150, 111.900
Resistance levels: 112.700, 112.900
If the price fixes above the resistance level of 112.700, the USD/JPY quotes are expected to rise. The movement is tending to 112.900-113.200.
Alternative option. If the price fixes below 112.450, we recommend looking for entry points to open short positions. The target movement level is 112.150-111.900


