
The EUR/USD currency pair
Technical indicators of the currency pair:
Prev Open: 1.17401
Open: 1.17479
% chg. over the last day: +0.03
Day’s range: 1.17308 – 1.17621
52 wk range: 1.0571 – 1.2557
There is an ambiguous technical pattern on the EUR/USD currency pair. The trading instrument is moving in the flat. A unidirectional trend is not observed. Local levels of support and resistance are 1.17400 and 1.17700, respectively. Demand for the euro is supported by the positive comments by the ECB head Draghi. The official expects the acceleration of inflation in the coming months. The EUR/USD quotes are tending to grow. We recommend opening positions from the key levels.
The news feed on 2018.09.25:
At 17:00 (GMT+3:00) we expect the consumer confidence index in the US.
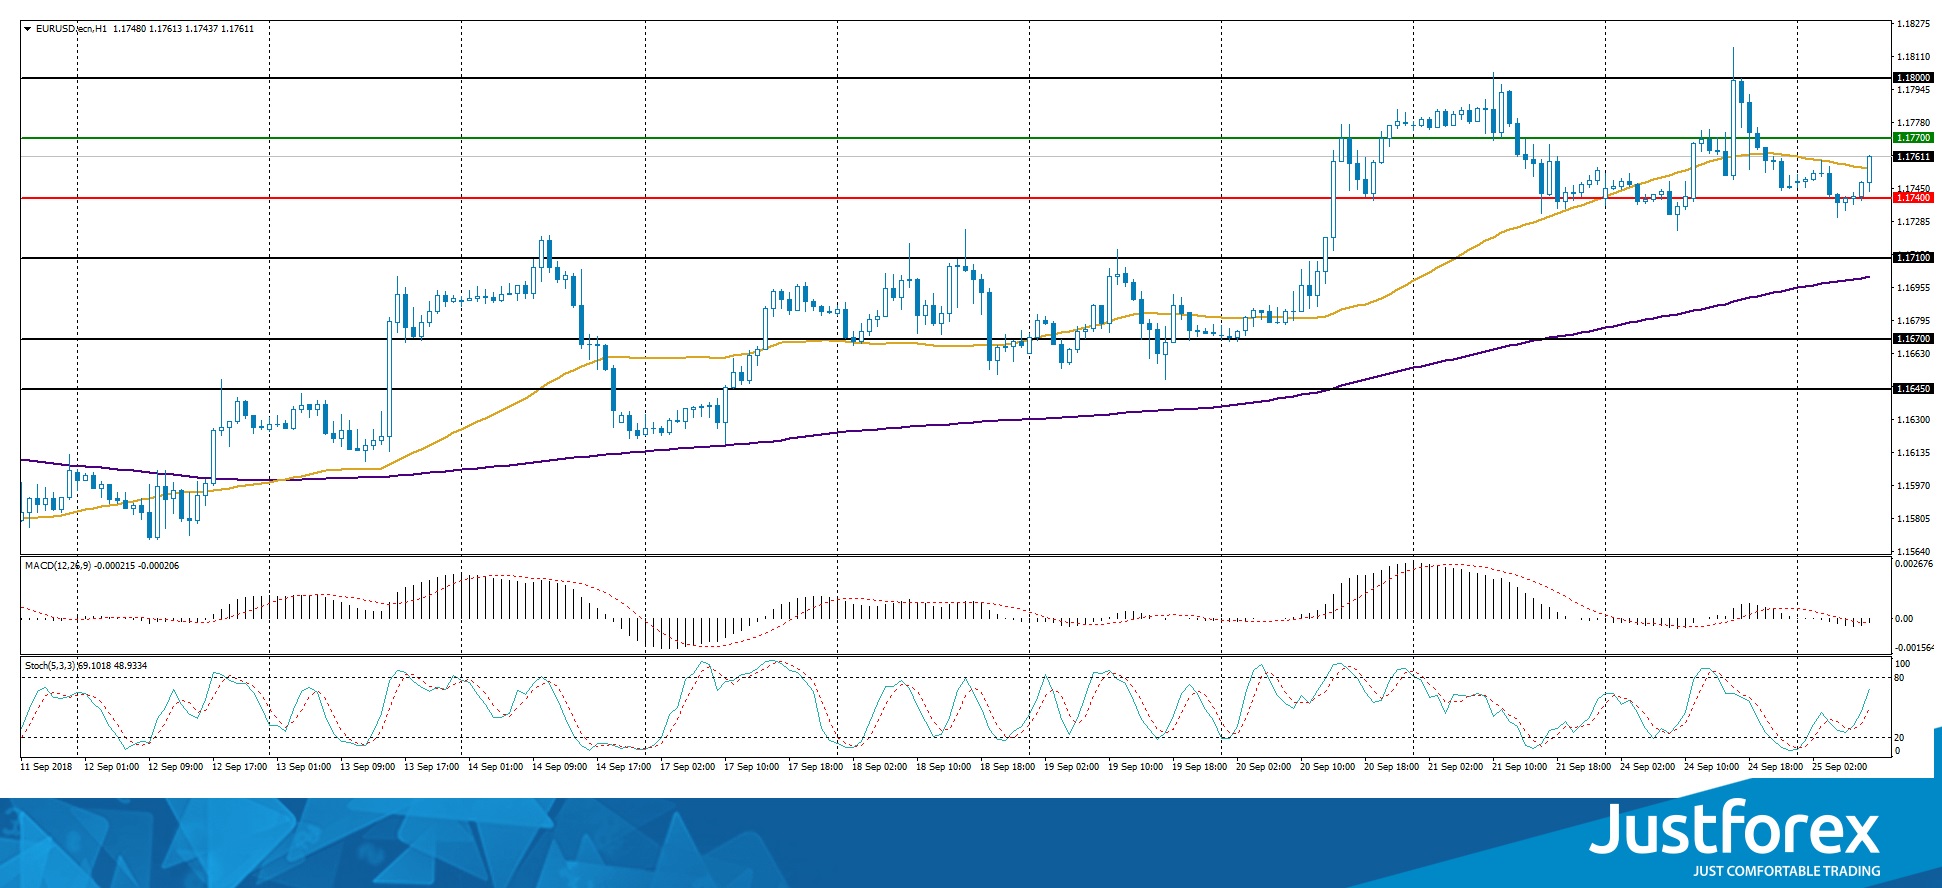
Indicators do not send accurate signals. The price has crossed 50 MA.
The MACD histogram is near the 0 mark.
Stochastic Oscillator is located in the neutral zone, the %K line is above the %D line, which signals the purchase of EUR/USD.
Trading recommendations
Support levels: 1.17400, 1.17100, 1.16700
Resistance levels: 1.17700, 1.18000
If the price fixes above the resistance level of 1.17700, further growth of the EUR/USD quotes is expected. The movement is tending to 1.18000-1.18250.
An alternative may be the reduction of the EUR/USD currency pair to 1.17100-1.17000.
The GBP/USD currency pair
Technical indicators of the currency pair:
Prev Open: 1.30749
Open: 1.31191
% chg. over the last day: +0.28
Day’s range: 1.31014 – 1.31229
52 wk range: 1.2361 – 1.4345
Currently, GBP/USD is consolidating. The technical pattern is ambiguous. The key range is 1.31000-1.31350. The pound remains under pressure amid uncertainty over the Brexit. The GBP/USD quotes are tending to decline. We recommend opening positions from the key levels.
The news feed on the UK economy is calm.
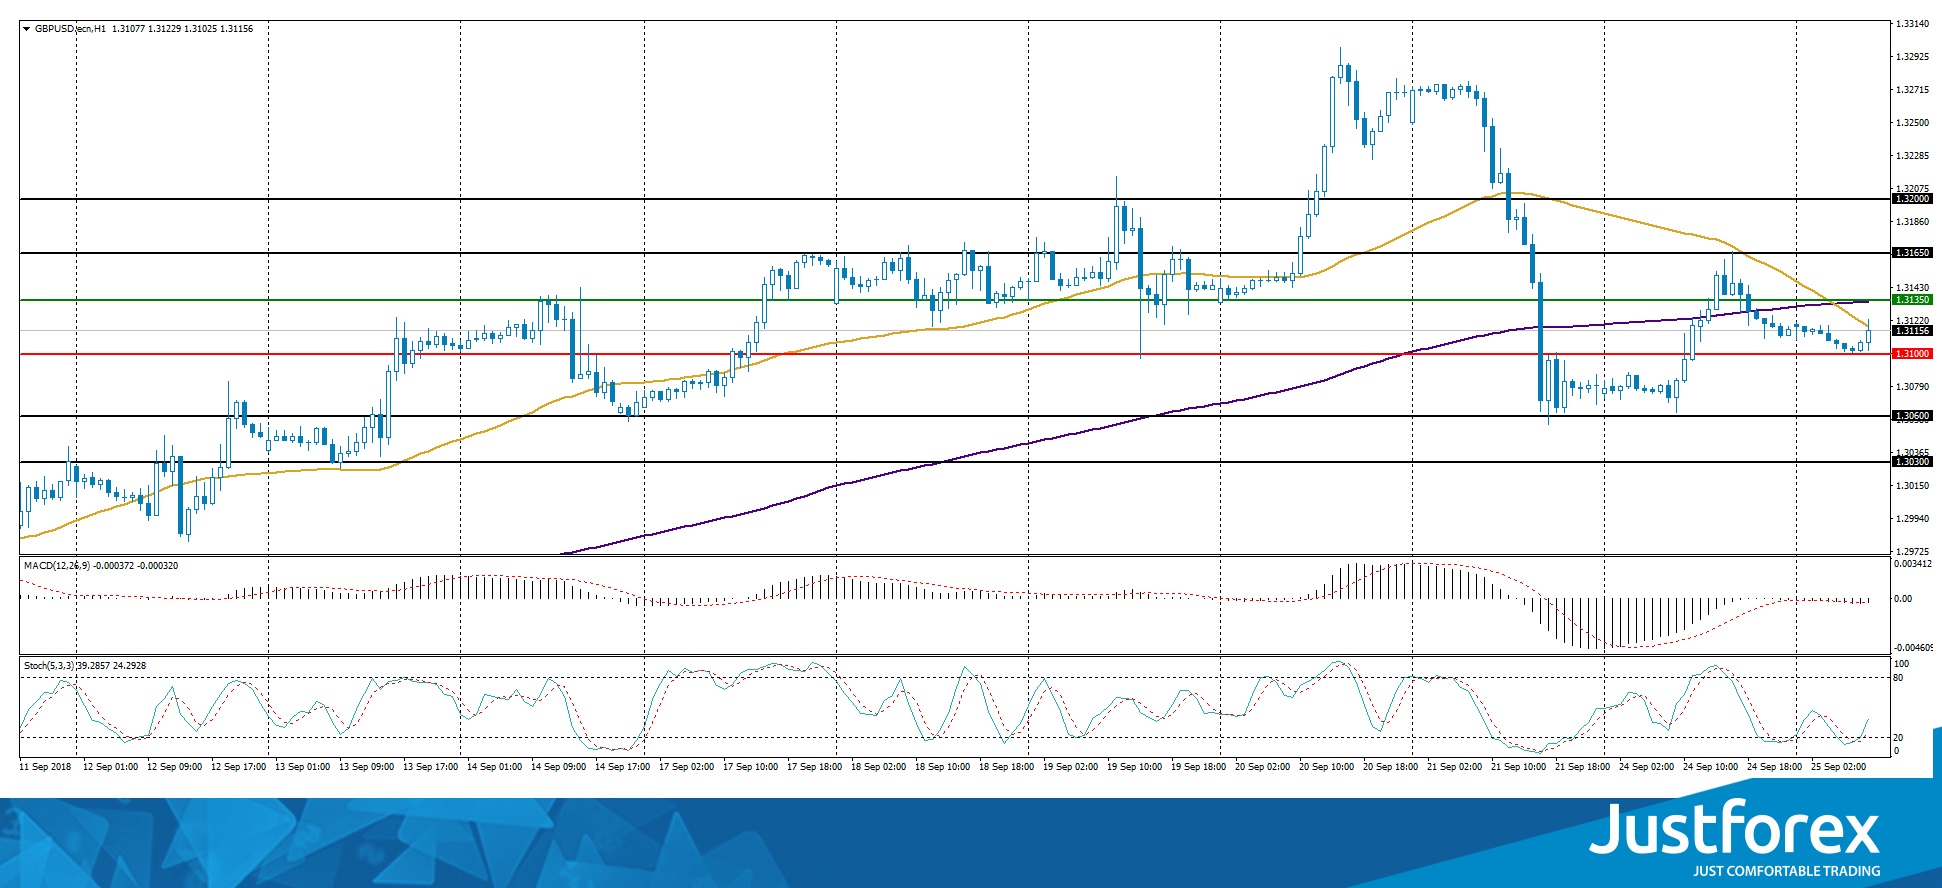
Indicators do not send accurate signals: 50 MA has crossed 200 MA.
The MACD histogram is located near the 0 mark.
Stochastic Oscillator is moving from the oversold zone, the %K line is above the %D line, which indicates the growth of GBP/USD.
Trading recommendations
Support levels: 1.31000, 1.30600, 1.30300
Resistance levels: 1.31350, 1.31650, 1.32000
If the price falls below the round of 1.31000, GBP/USD is expected to fall. The movement is tending to 1.30600-1.30300.
An alternative may be the correction of the GBP/USD currency pair to the level of 1.31650-1.32000.
The USD/CAD currency pair
Technical indicators of the currency pair:
Prev Open: 1.29243
Open: 1.29544
% chg. over the last day: +0.27
Day’s range: 1.29441 – 1.29661
52 wk range: 1.2059 – 1.3795
The USD/CAD currency pair has begun to recover after a significant fall in the past two weeks. At the moment, quotes are testing the local offer zone of 1.29600-1.29800. The mark of 1.29300 is already a “mirror” support. The trading instrument is tending to grow. Positions must be opened from the key levels. We recommend you to keep track of current information regarding the NAFTA negotiations.
The news feed on Canada’s economy is calm.
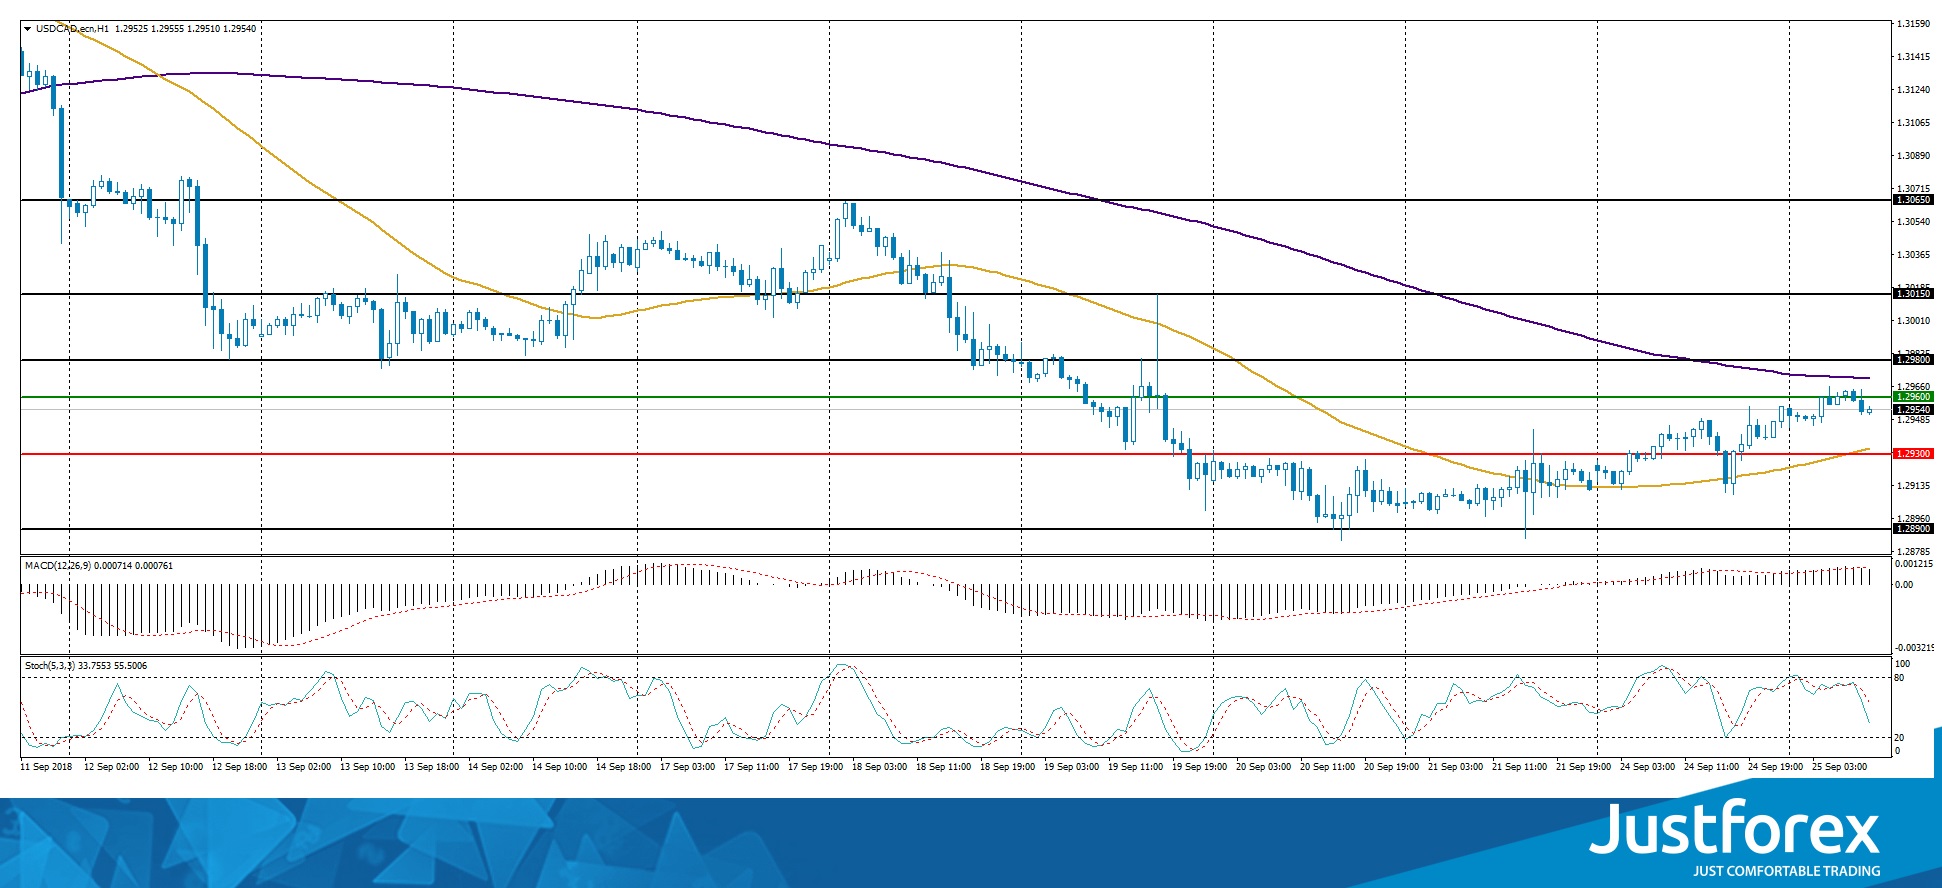
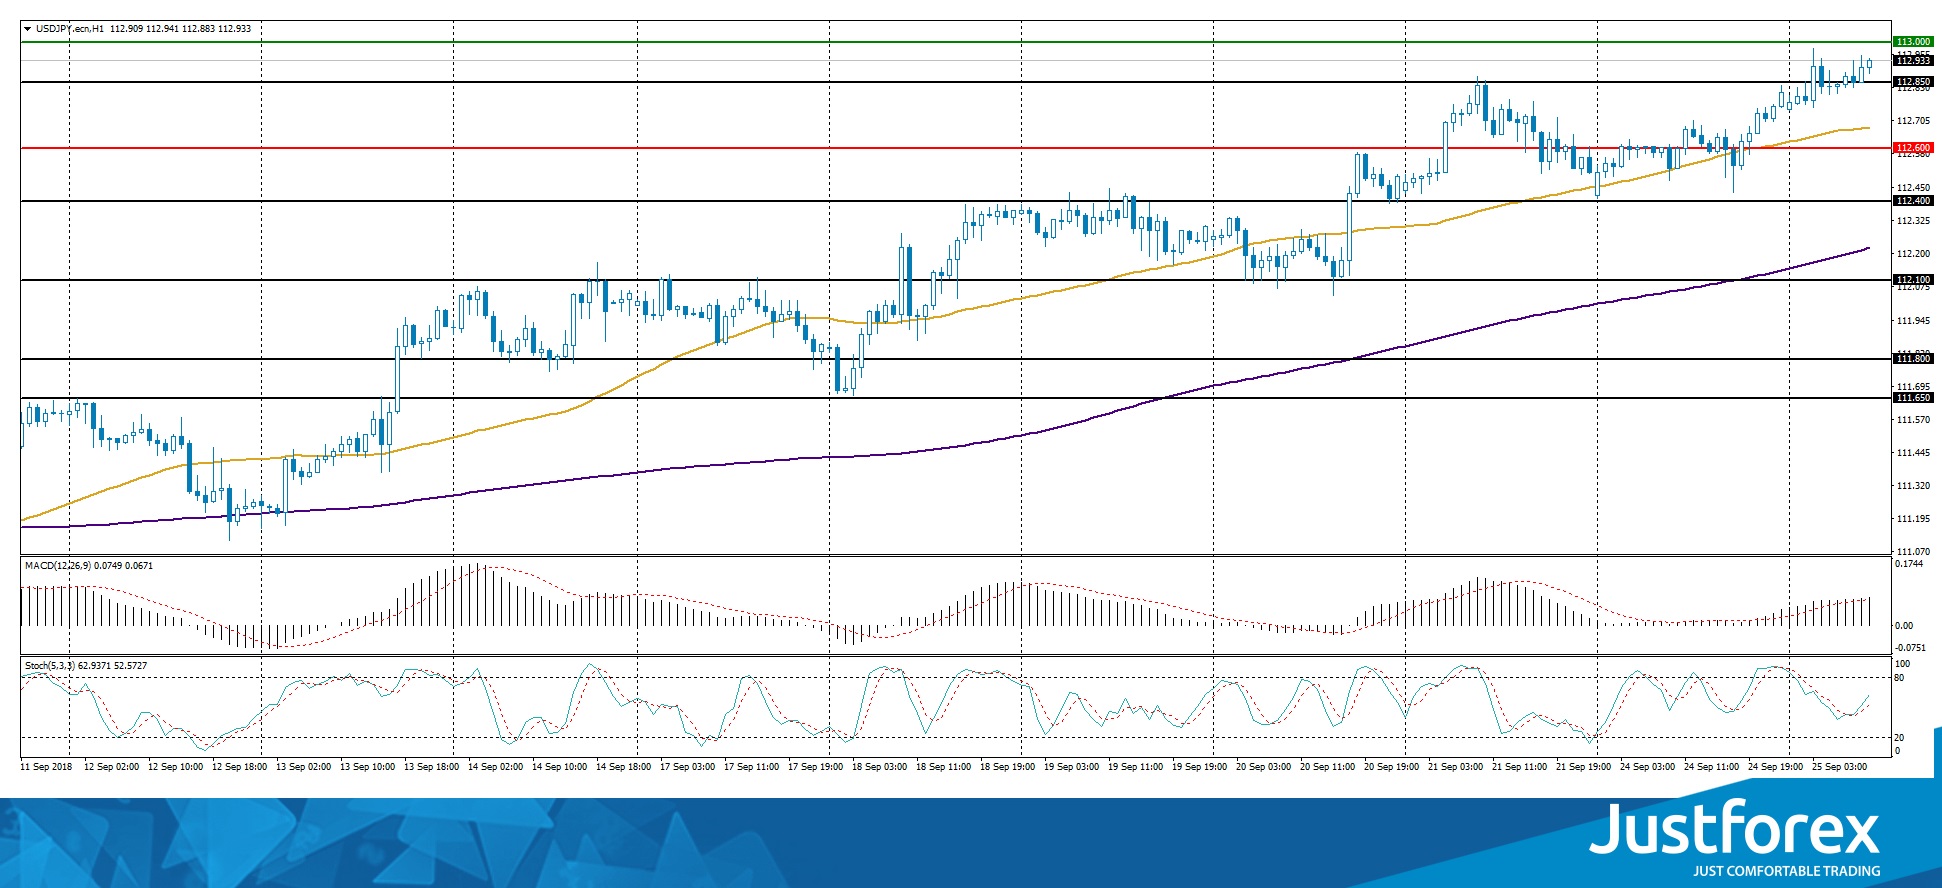
The price has fixed above 50 MA and 200 MA, which signals the power of buyers.
The MACD histogram is located in the positive zone and above the signal line, which gives a strong signal to buy USD/JPY.
Stochastic Oscillator is in the neutral zone, the %K line is above the %D line, which also indicates the growth of USD/JPY.
Trading recommendations
Support levels: 112.600, 112.400, 112.100
Resistance levels: 113.000, 113.500
If the price fixes above the round level of 113,000, further growth of USD/JPY is expected. The movement is tending to 113.400-113.600.
An alternative may be reduction of the USD/JPY currency pair to 112.600-112.400.


