
The GBP/USD is building a potential bear flag chart pattern, which could indicate more downside as long as price does not break above the flag.
The GBP/USD could be building a larger bearish reversal within a wave 1 (purple) of wave 5 (pink) if price makes a lower low by breaking below the support trend line (blue). A bullish break above the channel resistance could indicate an uptrend and invalidation of the current bearish wave 1 (purple) pattern.
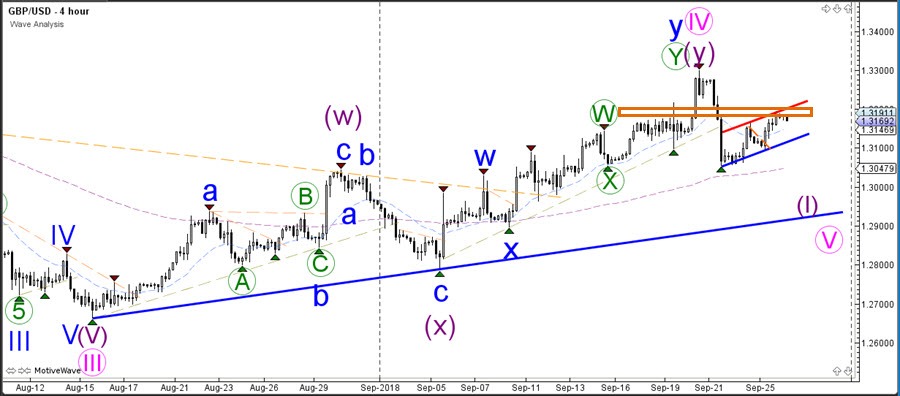
The GBP/USD bounced at the 61.8% Fibonacci resistance level after completing a potential bearish ABC correction (green). The support trend line (blue) of the bear flag chart pattern is key for a bearish breakout and continuation whereas a break above the resistance lines (orange) could indicate a bullish move.


