EUR/USD
The American dollar was able to attract some interest this Monday, ending the day generally higher across the board. The EUR/USD pair peaked at 1.1020 early Asian trading, its highest for this 2017, as centrist Emmanuel Macron became the new French president. But given that such result was mostly priced in, the common currency was unable to rally on the positive news. In the macroeconomic front, data released in Europe continued to indicate a healthy economic scenario, given that German Factory Orders surged by 1.0% in March, and by 2.4% when compared to a year earlier, slightly better-than-expected. Also, the EU Sentix Investor Confidence index advanced up to 27.4 in May, beating expectations of 25.3
The dollar gathered further momentum with the US opening, backed by comments from Fed’s Mester, who said that the Central Bank has already met its employment goal and is nearing its inflation goal, despite some weak recent economic data, so it should continue raising interest rates. US April labor market conditions index rose by 3.5%, following an upwardly revised 3.6% in March, becoming the two strongest readings since early 2015, and somehow reaffirming Mester’s comments.
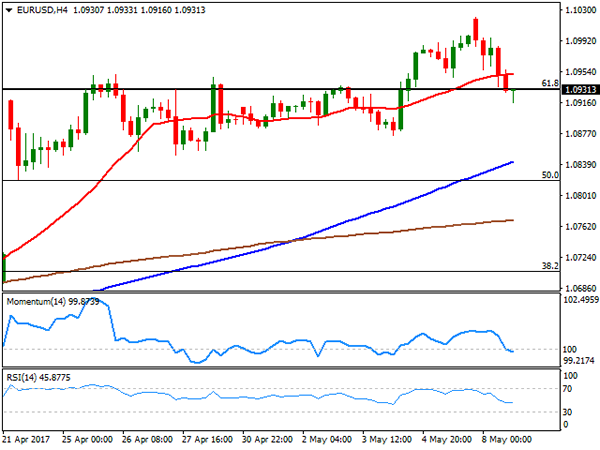
The EUR/USD pair fell to a daily low of 1.0916, bouncing back to settle around 1.0930 by the end of the US session, but short term poised to extend its decline, given that in the 4 hours chart, the price is developing below its 20 SMA, whilst technical indicators have entered negative territory although with limited bearish strength. The price is currently struggling around a major Fibonacci resistance, the 61.8% retracement of the post US-election slump, and will take either and advance beyond 1.0950 or a slide below 1.0890 to confirm directional strength this Tuesday.
Support levels:1.0950 1.0900 1.0855
Resistance levels: 1.1045 1.1080 1.1120
USD/JPY
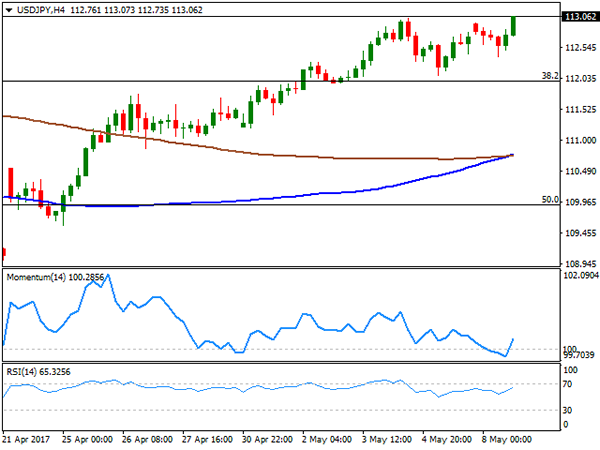
The USD/JPY pair surged in the US afternoon to a fresh 2-month high of 113.09, after trading uneventfully around Friday’s close for most of the day. The advance came as the market turned its attention to Central Banks, particularly the US Federal Reserve and chances of a June hike, revived by comments from Fed’s Mester, who claimed that the economy has pretty much achieved Fed’s goals. The US will release its April inflation figures this Friday, and a better-than-expected reading will support the case further for some further dollar gains. Rising US Treasury yields also backed the intraday rally, with the 10-year note benchmark up to 2.38% from previous 2.35%. The pair is gaining bullish potential ahead of the Asian opening, although further gains would need additional confirmation. In the 4 hours chart, the 100 and 200 SMAs converge around 110.70, while technical indicators have turned north, with the Momentum still within neutral territory and the RSI around 65, enough at least, to keep the downside limited. Early March lows in the 113.60 region provide a critical resistance that needs to be broken before a steeper recovery.
Support levels: 112.80 112.45 112.00
Resistance levels: 113.30 113.65 114.00
GBP/USD
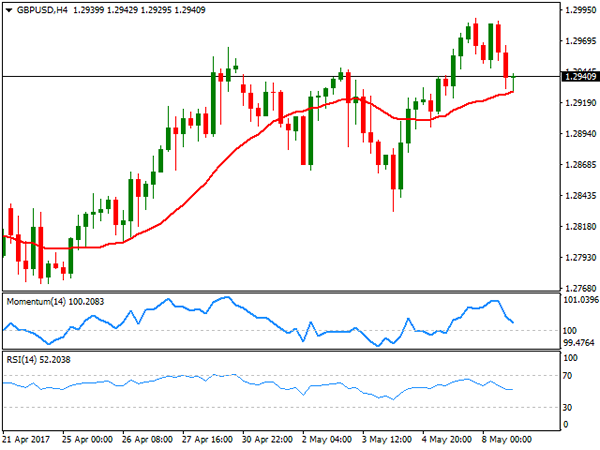
The GBP/USD pair closed the day not far from a daily low of 1.2931, marginally lower after topping at 1.2988 last Friday. The pair holds near the mentioned daily high, reluctant to dollar’s intraday advance. The macroeconomic calendar in the UK was extremely light, with no fresh headlines about upcoming Brexit negotiations and just the Halifax House Price index being released. According to the report, house prices in the three months to April were 3.8%, matching a year earlier reading, while when compared to March, house prices fell by 0.1%. During Asian trading hours, the British Retail Consortium will release its April retail sales measure. In the meantime, the pair presents a neutral stance according to the 4 hours chart, as the intraday decline stalled around a horizontal 20 SMA, now the immediate support, whilst technical indicators turned south within positive territory, losing downward strength near their mid-lines. The pair can fall further on a downward acceleration below 1.2890, but the trend will only be considered bearish with a move below 1.2770.
Support levels: 1.2930 1.2885 1.2850
Resistance levels: 1.2965 1.3010 1.3060
GOLD
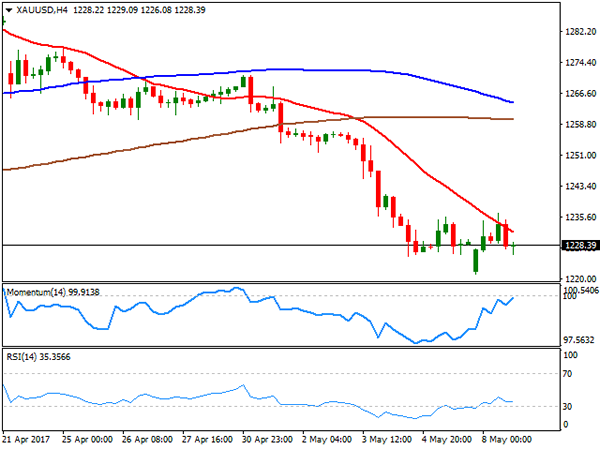
Gold prices rallied at the beginning of the day, but were unable to hold on to gains and trimmed all of their daily gains ahead of the close. Spot settled at $1,228.19 a troy ounce, as with French elections out of the way, attention shifted back to the US and the possibility of a June rate hike. The bright metal fell in the American afternoon down to a daily low of 1,226.08, and maintains the bearish tone seen on previous updates given that the early advance was rejected on a test of the 100 DMA. Furthermore, the daily chart shows that the Momentum indicator resumed its decline after a brief upward correction, whilst the RSI indicator remains flat around 33. Shorter term, the 4 hours chart shows that the price was contained by a bearish 20 SMA, currently at 1,231.85, while technical indicators have managed to correct extreme oversold readings, but remain within bearish territory, with the RSI heading south around 34 and anticipating some further slides ahead.
Support levels: 1,225.60 1,214.10 1,203.80
Resistance levels: 1,231.85 1,242.50 1,250.90
WTI CRUDE OIL
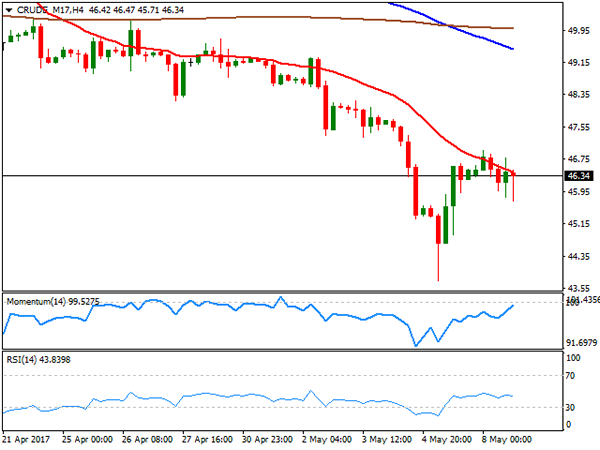
Crude oil prices closed the day pretty much unchanged, with West Texas Intermediate futures ending at $46.40 a barrel, reverting an early slide down to 45.71. The commodity was unable to attract buyers, despite news showing OPEC and non-OPEC producers are considering extending supply cuts into 2018, as US increasing production revived concerns over a worldwide glut. The daily chart for US oil shows that technical indicators have managed to correct the extreme oversold readings reached late last week, but the RSI is currently flat around 28, while the Momentum indicator recovered within positive territory, rather indicating limited selling interest than suggesting further gains ahead. In the 4 hours chart, the commodity remained capped by a bearish 20 SMA, while technical indicators also corrected oversold conditions but remain within bearish territory, in line with the longer term perspective. The commodity remains vulnerable, with chances of a dip down to the 42.00/42.50 region later this week.
Support levels: 45.90 45.30 44.70
Resistance levels: 47.10 47.75 48.50
DJIA
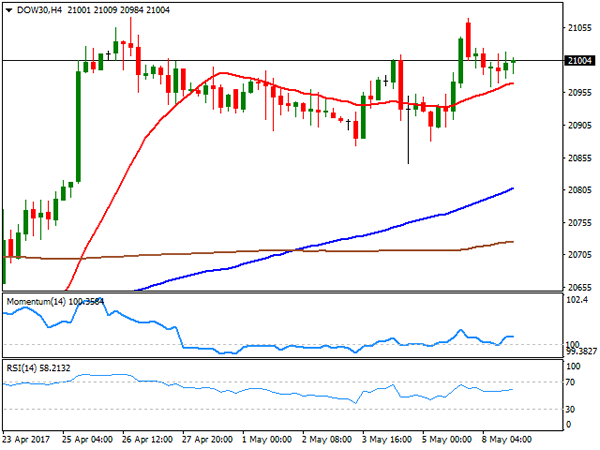
Wall Street closed little changed after a dull trading session, with the DJIA up 5 points, to 21,012.28, and the Nasdaq Composite advancing 2 points, to 6,102.66. The S&P ended the day unchanged at 2,399.38, holding near record highs set last week. Within the Dow, Apple was the best performer, adding 2.71%, followed by Exxon Mobil that managed to advance 1.05%. El du Pont remains among the worst performers this month, leading decliners with a 1.10% loss, followed by Goldman Sachs that shed 0.86%. The technical picture hasn’t changed, with the benchmark still confined to a tight range daily basis, and neutral-to-bullish, as in the daily chart, it holds above a bullish 20 DMA, whilst technical indicators hold well above their mid-lines, lacking clear directional strength. In the 4 hours chart, intraday slides were reverted on approaches to a still bullish 20 SMA, whilst technical indicators also stand pat within positive territory.
Support levels: 20,986 20,939 20,898
Resistance levels: 21,030 21,071 21,138
FTSE100
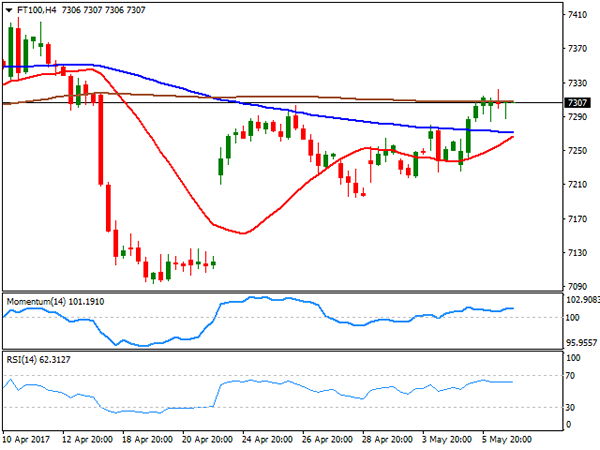
The FTSE 100 added 3 points, closing at 7,300.86, despite the sour tone of the leading mining sector. A weaker Pound partially offset losses in the sector, which fell on news that Chinese imports rose by less than expected in April, spurring concerns of base metals’ demand. Anglo American suffered the most, leading decliners with a 2.04% loss, followed by Antofagasta that shed 2.02%. Intu Properties was the best performer, advancing 2.15% after housing data released earlier on the day showed steady growth in prices. Daily basis, the index presents a neutral-to-bullish stance as despite holding above its moving averages, technical indicators are flat around their mid-lines, indicating the absence of demand. In the 4 hours chart, the index was unable to surpass its 200 SMA, holding around it, whilst indicators remain within positive territory, but also lacking upward strength.
Support levels: 7,284 7,247 7,200
Resistance levels: 7,332 7,385 7,439
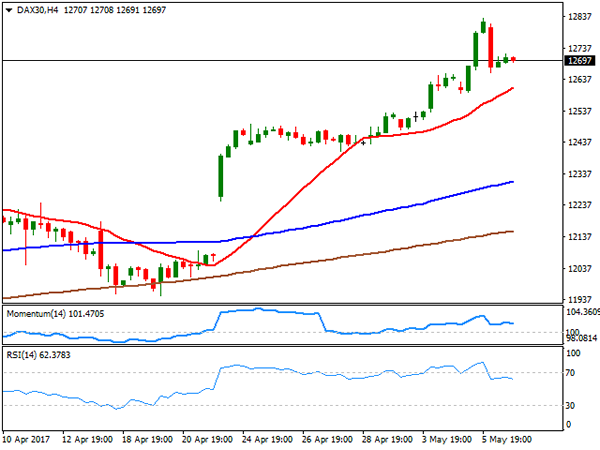
DAX
European equities closed the day generally lower, with the German DAX settling at 12,694.55, down by 0.18% or 22 points, with base metal-related equities leading the way lower after Chinese trade balance showed that the world’s second largest economy reduced its buying to the slowest pace in six months. Equities briefly rallied at the opening on Macron’s victory, but gains were quickly reverted. Within the DAX, only 8 members managed to close with gains, with Deutsche Lufthansa being the best performer, up 3.47%. Commerzbank led decliners, ending the day 3.28% lower, followed by Linde that shed 2.17%. Daily basis, the index remains near record highs and above all of its moving averages that retain their bullish slopes, whilst technical indicators have barely retreated within overbought levels, limiting the risk of a steeper decline. Shorter term, and according to the 4 hour chart, the downward potential is also limited, with the price remains well above a bullish 20 SMA as technical indicators retreated from overbought levels, but lost downward strength well above their mid-lines.
Support levels: 12,668 12,623 12,575
Resistance levels: 12,720 12,765 12,812