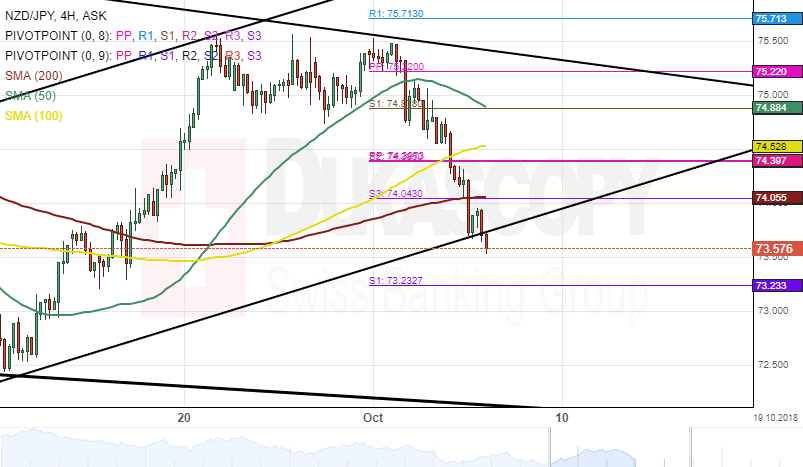
The bullish momentum that began early September has guided the NZD/JPY exchange rate higher towards the upper boundary of a descending channel at 75.50.
The currency pair made a U-turn from the upper boundary of the descending channel pattern a few days ago and currently trading near the bottom boundary of a one-month ascending channel at 73.66.
Given that the currency exchange rate has breached the lower boundary of the channel, the next target for the pair will be near the monthly S1 at 73.23.
Furthermore, the three SMAs are currently located above the price level on the 4(H) time frame and could give further confirmation of a downside momentum during the following trading sessions.