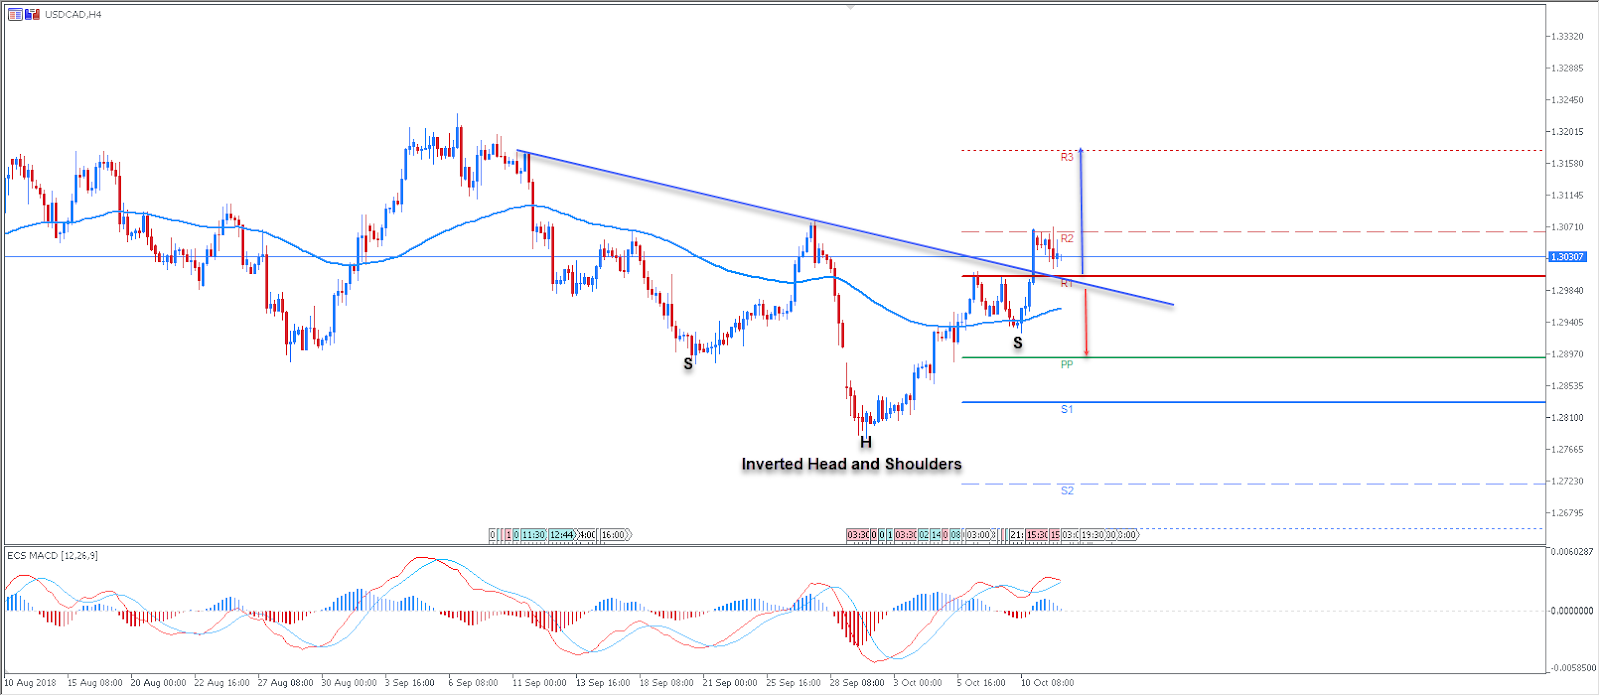
The USDCAD currency pair has formed an inverted head and shoulders pattern. The breakout occured at the R1 Resistance. The calendar will be light on the CAD data, but due to standard Friday profit taking, volatility could be present during the London/New York session. The main USD news for Friday is based on measuring the level of a composite index, based on surveyed consumers – Preliminary UoM (University of Michigan) Sentiment. Don’t forget to follow our Forex calendar for all regular updates on the news,economic announcements, forecasts and much more.
Technically, the USD/CAD currency pair has opened room for further gains. Above the R1 and trend line confluence, we could also see the R2 break with a final target at R3 – 1.3175. However, as Friday is a profit taking day, we might also see a bearish price action. Bears might start to dominate below 1.2980. A sustained break below 1.2980 should target the Weekly Pivot Point (PP) at 1.2892.
Pivot Lines – Weekly Support and Resistance
POC – POC – Point Of Confluence (The zone where we expect the price to react – aka the entry zone)