
U.S. yields have stabilized after the sell-off and this will be a key focus for next week
The Sell-Off in equities continued with very high volumes and VIX index climbed to the highest level since February. However, U.S. yields have stabilized after the sell-off and this will be a key focus for next week. Italy continues to be under the spotlights. China September exports surged and this confirmed that the country isn’t going to fall off the cliff. China still has record surplus with the U.S. despite the new tariffs. Oil has it is the biggest weekly drop since May.
Technical Analysis:
EURUSD
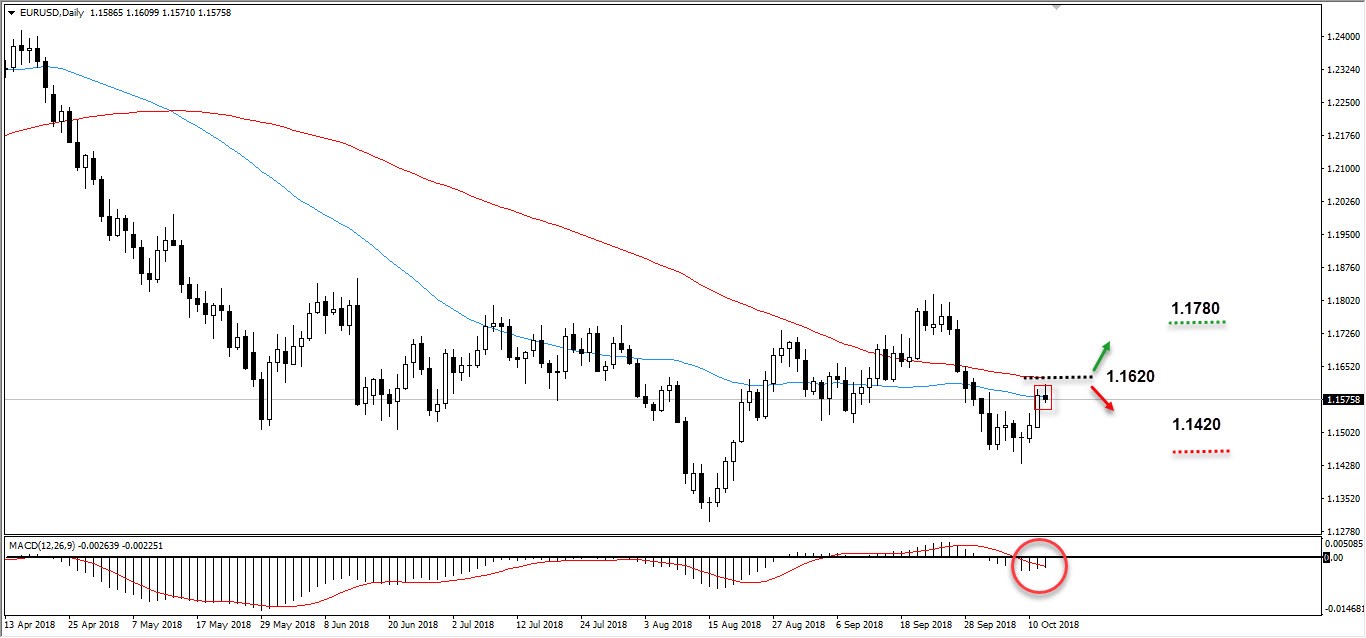
EURUSD has rebounded from major support at 1.14s levels on a daily time frame. The price is below a critical level at 1.1620/1.1650 and this confirms that the trend is skewed to the downside. Having said this, the price is firmly trading below the 50 and 200-day moving averages which shows that the there are higher chances that the price may continue its downward move. Currently, there is a battle between the price and the 50/200-day moving average and if the price breaks towards the upside it will strength the odds for the uptrend.
The Balance of Power shows that the bears are still controlling the momentum, we need to see this momentum to continue next week and this would support the above argument.
All the important support and resistance zones are shown on the chart below.
GBPUSD
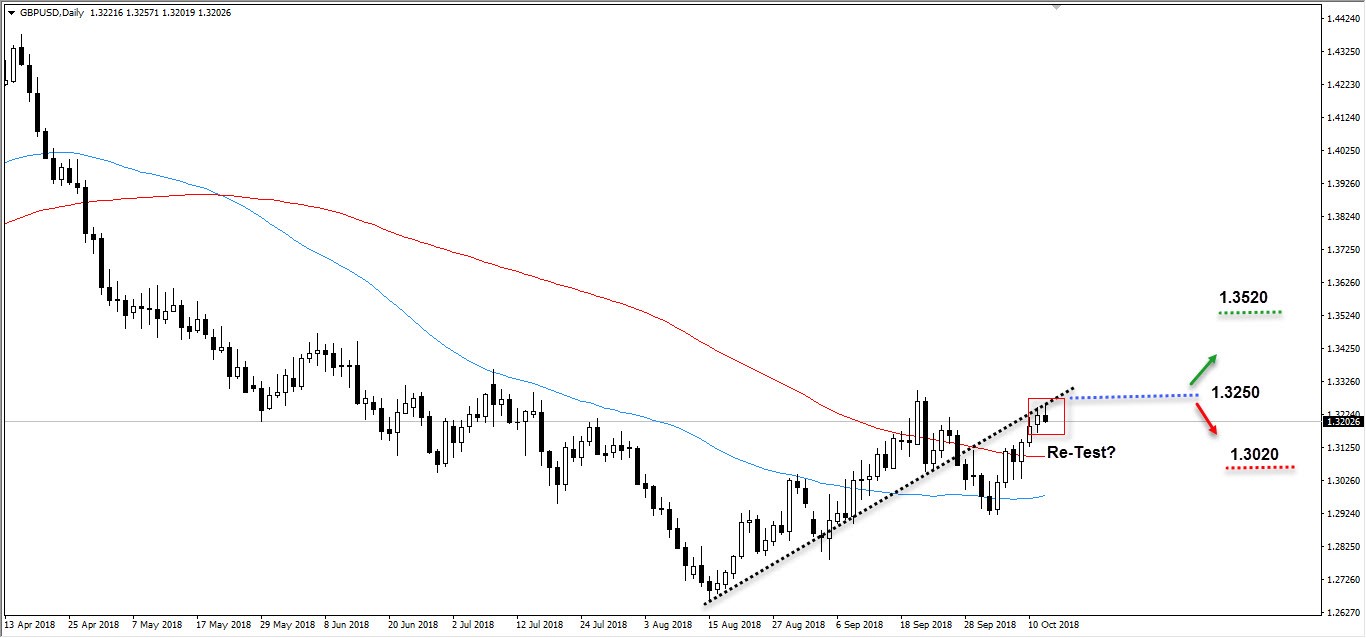
GBPUSD is trading near the broken short-term up trend on its daily time-frame. The price is trading below 1.3250 and recent high of 1.3250s and this confirms that the trend is skewed to the downside. Currently, there is a battle between the price and the major resistance and if the price breaks towards the upside, the odds will be even stronger that the uptrend will shape up from there.
The Balance of Power shows that the bulls are still controlling the momentum, we need to see this fading and that would support the above argument.
The resistance is shown by the green horizontal line which is the highest point which the price made on the 14th of June. The support is show by the red line which is the lowest point formed on the 5th of October.
XAUUSD
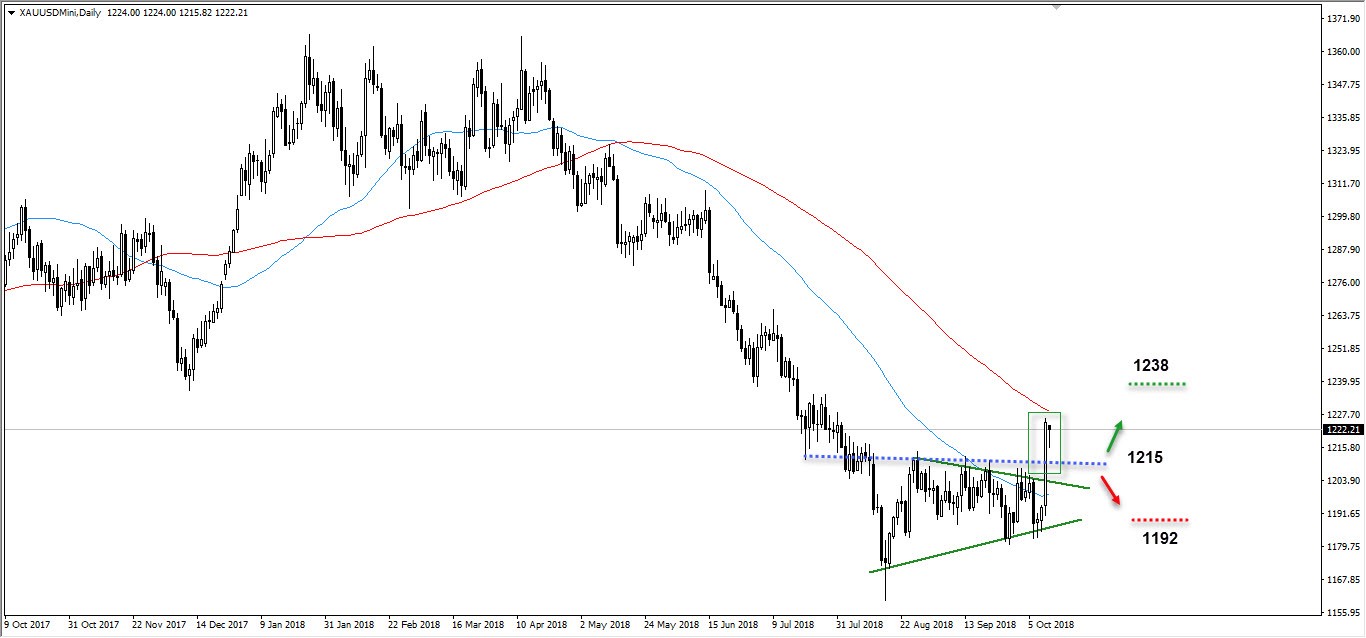
The yellow metal has broken-out the symmetrical triangle on it daily time frame. The price is trading in a bullish momentum and this confirms that the trend is skewed to the upside. Having said this, the price is firmly trading above the 50-day moving averages which shows that the there are higher chances that the price may continue it bullish move. Currently, there is a battle between the price and the 200-day moving average and if the price breaks towards the upside, the odds will be even stronger that the uptrend will shape up from there.
The Balance of Power shows that the bulls are still controlling the momentum, we need to see this continues and that would support the above argument.
The resistance is shown by the green horizontal line which is the highest point which the price made on the 17th of July. The support is show by the red line which is the lowest point formed on the 10th of October.
Oil
Oil is trading within its upward channel on a daily time frame. After, touching the upper line of the channel, it is moving toward the bottom line of this channel. This shows that the bears are taking back the control but the uptrend is still intact. Currently, there is a battle between the price and the resistance level (shown by blue horizontal line as shown on the chart) and if the price failed to break it to the upside, the odds will be even stronger that the downward move will continue from there.
The Balance of Power shows that the bears are still controlling the momentum, we need to see this continue and that would support the above argument.
The resistance is shown by the green horizontal line which is the highest point which the price made on the 3rd of September. The support is show by the red line which is the lowest point formed on the 17th of September.


