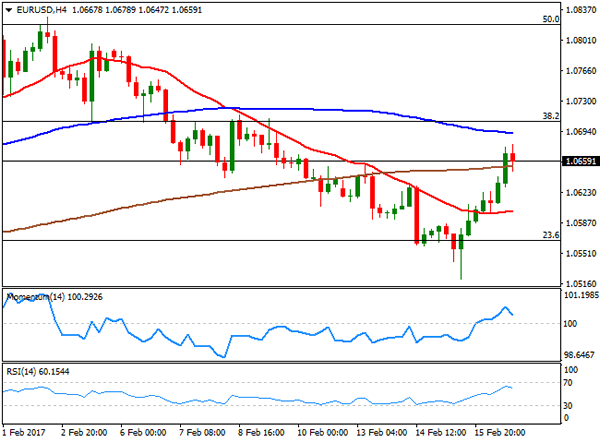
EUR/USD
The greenback closed the day mixed across the board, lower against the EUR and the JPY, as a decline in worldwide stocks added to the early downward correction of the American currency, despite the release of upbeat economic data and a hawkish Yellen. There was no fundamental trigger behind dollar’s retracement, although it is a clear indication on how soft confidence on Trump´s promises is, and how willing investors are to take profits out on dollar’s gains these days, after the US president complained about dollar’s strength.
There were no relevant news coming from the EU, while figures coming from the US were generally positive, as weekly unemployment claims for the week ending February 10 printed 239K, better than the 245K expected, although the 4-week average was 245,250, an increase of 500 from the previous week’s revised average. Housing starts in December rose to 1.246M, while Building Permits reached 1.285M, both beating expectations and previously upwardly revised figures.
The EUR/USD pair pared gains at 1.0678, and settled around 1.0660, and the 4 hours chart shows that the price is well above a flat 20 SMA for the first time in over a week and currently at 1.0600, but still below a modestly bearish 100 SMA around 1.0700. In the same chart, technical indicators have turned lower within positive territory, not enough to suggest a downward move for this Friday, but putting a cap to the upward move. The pair has a major resistance at 1.0700/20, the level to beat to confirm further dollar losses in this last day of the week.
Support levels: 1.0620 1.0590 1.0565
Resistance levels: 1.0710 1.0750 1.0795
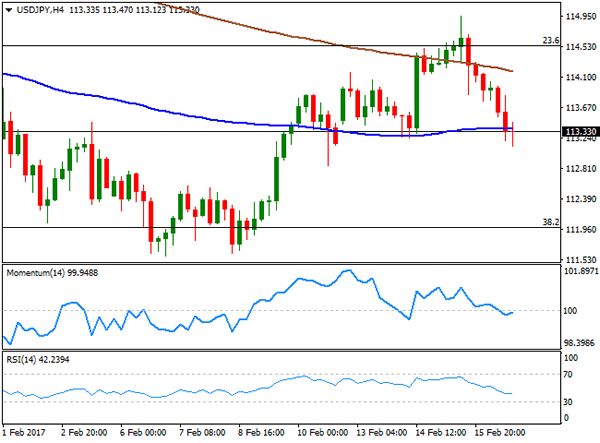
USD/JPY
The Japanese yen is the best performer against the greenback daily basis, with the USD/JPY pair ending the day not far from a daily low of 113.12 achieved in the US afternoon. Helping the pair slide were US Treasury yields coming off highs, with the 10-year benchmark slipping to 2.44% after reaching 2.52% on Wednesday. The macroeconomic calendar will remain empty in Japan for the rest of the week, which means that the pair will remain tied to stocks and bond yields. The sharp retracement following the approach to the 115.00 threshold somehow indicates that yen’s demand is still quite strong, and that chances are now supporting a steeper downward. In the 4 hours chart, technical indicators have entered negative territory, although with limited bearish strength, whilst the price has broken below its moving averages, after failing to rally beyond the 200 SMA. The 100 SMA lacks directional strength, now around 113.40, an immediate short term resistance. A downward acceleration below 113.00 will probably lead to a continued decline towards the 112.00/20 region.
Support levels: 112.90 112.50 112.10
Resistance levels: 113.40 113.85 114.20
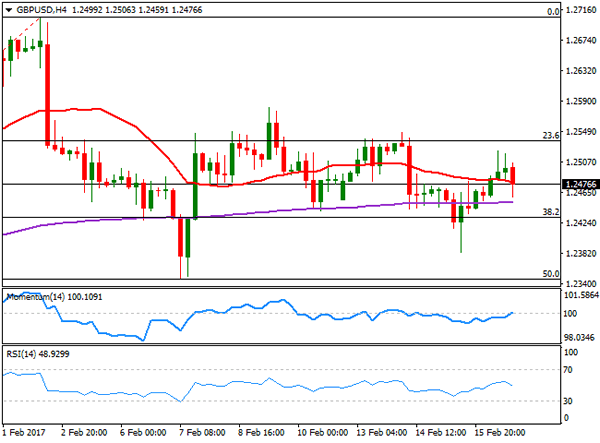
GBP/USD
The Pound benefited from broad dollar’s weakness, resulting in the GBP/USD pair rallying up to 1.2518, but once again, the pair was rejected from the critical resistance area around 1.2530/40, to close marginally higher around 1.2480. There were no macroeconomic releases in the UK, but the kingdom will release its January retail sales figures this Friday, expected to have risen by 0.9% in the month from a previous decline of 1.9%. Despite some wild swings, the pair has closed pretty much flat for a second consecutive day, indicating that investors are not sure on where to go next, after latest data coming from the UK proved less resilient to Brexit woes. Another negative reading will likely dent sentiment towards the Pound, although as long as the price remains above 1.2330/50, the downward potential will remain limited. Technical readings in the 4 hours chart maintain the neutral stance seen on previous updates, with the price hovering around flats 20 SMA and 200 EMA, the Momentum indicator holding directionless around its 100 level and the RSI now turning south around 48.
Support levels: 1.2430 1.2380 1.2345
Resistance levels: 1.2500 1.2535 1.2585
GOLD
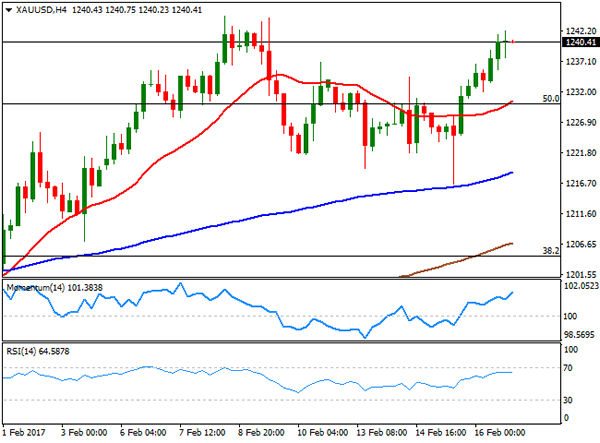
Gold prices recovered ground and trade neared this year high of $1.244.67 a troy ounce before settling at 1,240.30, boosted by a decline in USD-related assets. Despite odds for a US FED March rate hike have increased after Yellen testimony before the Congress, gold has held on to gains and at multi-months’ highs, suggesting further gains ahead for the commodity, and a fading correlation between it and the US Central Bank monetary bias. From a technical point of view, the daily chart shows that that the price recovered further above a bullish 20 DMA and the 50% retracement of the post-US election decline, while the RSI heads higher around 65, supporting the bullish case, despite the lack of Momentum. In the 4 hours chart, the 20 SMA turned higher around the mentioned Fibonacci support at 1,230.00, while the Momentum indicator heads north near overbought readings and the RSI indicator consolidates around 64, in line with the longer term perspective.
Support levels: 1,230.00 1,221.80 1,210.10
Resistance levels: 1,244.70 1,252.90 1,261.60
WTI CRUDE
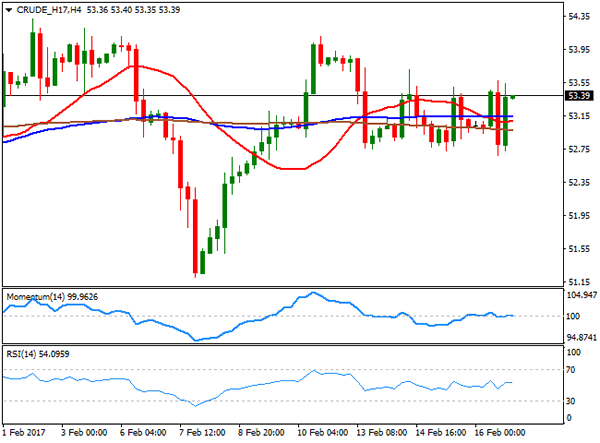
Crude oil prices held within familiar ranges, with West Texas Intermediate futures closing the day marginally higher at $53.38 a barrel. A weaker dollar and news suggesting that the OPEC could extend its oil output cut and even apply deeper ones, was not enough to trigger demand for the commodity, with sentiment dented by large US stockpiles builds and increasing production. US light, sweet crude has made little progress, still neutral daily basis, with the price hovering around a flat 20 SMA and technical indicators lacking directional strength, stuck around their mid-lines. In the 4 hours chart, the moving averages converge in a tight 40 cents range, the Momentum indicator is flat at its 100 level, whilst the RSI indicator also consolidates around its mid-line. As commented on previous updates, the fundamental background favors a bearish extension, but it will take a break below 52.60 to confirm such move, with WTI then poised to test the key 50.00 figure.
Support levels: 53.00 52.60 52.00
Resistance levels: 53.70 54.40 55.20
DJIA
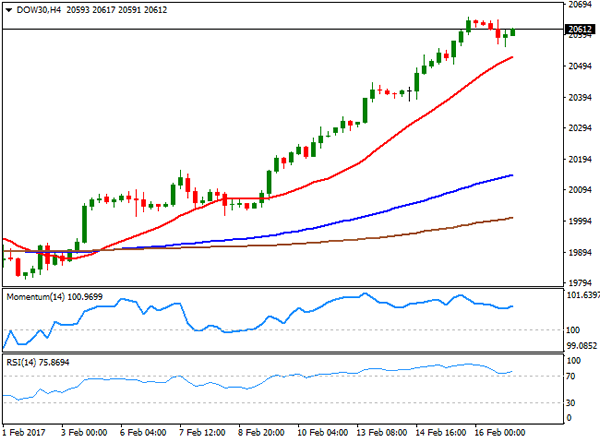
US indexes closed the day pretty much flat, although the Dow Jones Industrial Average managed to settle at a record high for sixth consecutive session, by adding roughly 8 points and closing at 20,619.77. The Nasdaq Composite closed at 5,814.90, down 4 points, whilst the S&P ended at 2,347.22, 2 points or 0.09% lower. Within the Dow, energy-related equities were the worst performers, with Chevron down 1.68%, followed by Exxon Mobil that lost 1.03%. Cisco Systems led winners’ list, up 2.38%. In the DJIA daily chart, technical indicators are losing upward momentum, but remain within extreme overbought readings, whilst the index trimmed its daily loses and holds well above bullish moving averages, all of which maintains the risk towards the upside. In the 4 hours chart, the technical indicators have corrected partially within overbought territory before turning back higher, whilst the 20 SMA has accelerated its advance, approaching the current level, now at 20,524, in line with the longer term outlook.
Support levels: 20,609 20,552 20,506
Resistance levels: 20,652 20,700 20,750
FTSE 100
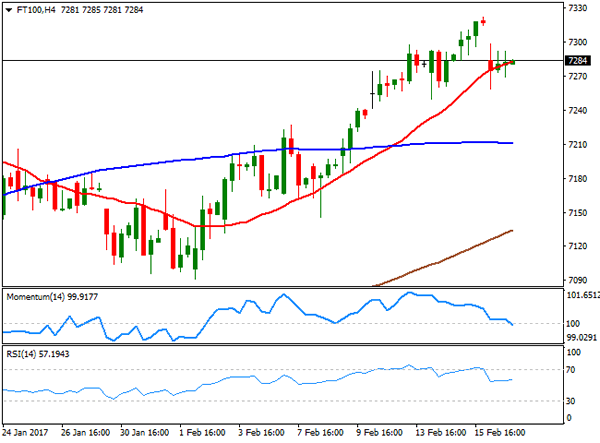
The FTSE 100 lost 24 points or 0.34%, to close the day at 7,277.92, weighed by companies going ex-dividend. Despite higher gold prices, mining related shares closed in the red, with Antofagasta down 3.47% and Anglo American shedding 1.55%. Royal Dutch Shell lost 2.24% as the energy-related sector also edged lower. A stronger Pound also weighed on the Footsie, as the GBP/USD pair recovered the 1.2500 level and closed the day not far below it. Daily basis, the index remains well above its moving averages, with the 100 and 200 DMAs maintaining bullish slopes, but the 20 DMA flat around 7,200, whilst technical indicators are losing upward strength, but still within positive territory. In the 4 hours chart, the index is stuck around a bullish 20 SMA, whilst technical indicators have retreated towards their mid-lines, failing to provide clues on what’s next for the index.
Support levels: 7,254 7,208 7,167
Resistance levels: 7,291 7,354 7,390
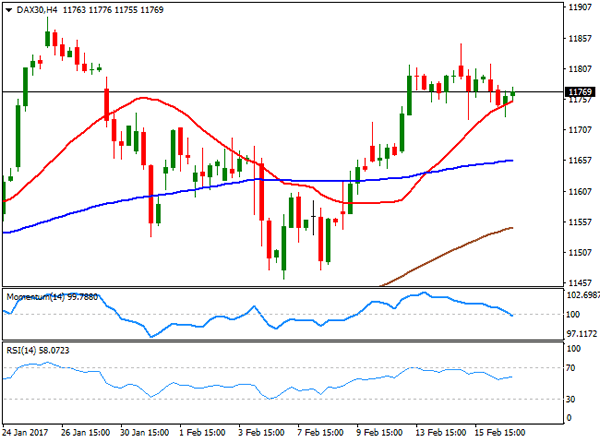
DAX
The German DAX closed at 11,757.24, down 0.31%, as banking and energy-related equities weighed lower. Commerzbank was the worst performer, down 243%, followed by Deutsche bank that lost 1.66% and Volkswagen that shed 1.49%. Deutsche Lufthansa added 1.74% making it to the top of winners’ list. The benchmark trimmed most its intraday losses for a second consecutive day, somehow indicating that the market is not ready to sell. In the daily chart, the 20 DMA remains as the main dynamic support at 11,681, the Momentum indicator continues consolidating around its 100 level, while the RSI indicator has turned modestly lower around 60, overall indicating a neutral stance. In the 4 hours chart, the index is holding above a bullish 20 SMA, while the RSI indicator bounced modestly from its mid-line, although the Momentum indicator heads sharply lower, entering bearish territory. The daily low was set at 11,728, with a break below it probably favoring a steeper decline for this Friday.
Support levels: 11,728 11,694 11,640
Resistance levels: 11,796 11,848 11,891