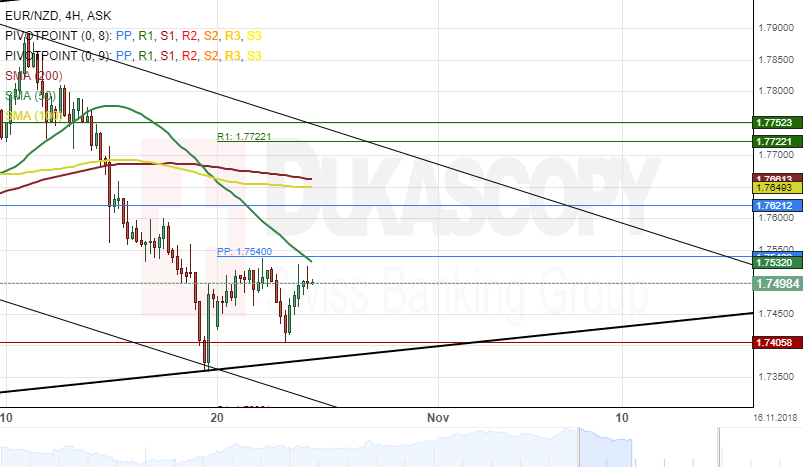
The common European currency has lost about 3.20% of its values against the New Zealand Dollar since the first week of October. This decline started after the currency pair made a U-turn south from the upper boundary of a long-term ascending channel at 1.7933 on October 8.
The exchange rate is trading near a resistance cluster formed by the weekly PP and the 50-hour simple moving average during the morning hours of Thursday’s trading session.
If this resistance level holds, the currency exchange rate could aim at the bottom border of the long-term channel at 1.7350.
Furthermore, technical indicators flash a bearish signal on the daily time frame.