Sterling is weak against the dollar but the move isn’t the same agains the Euro, there is an important reason behind this.
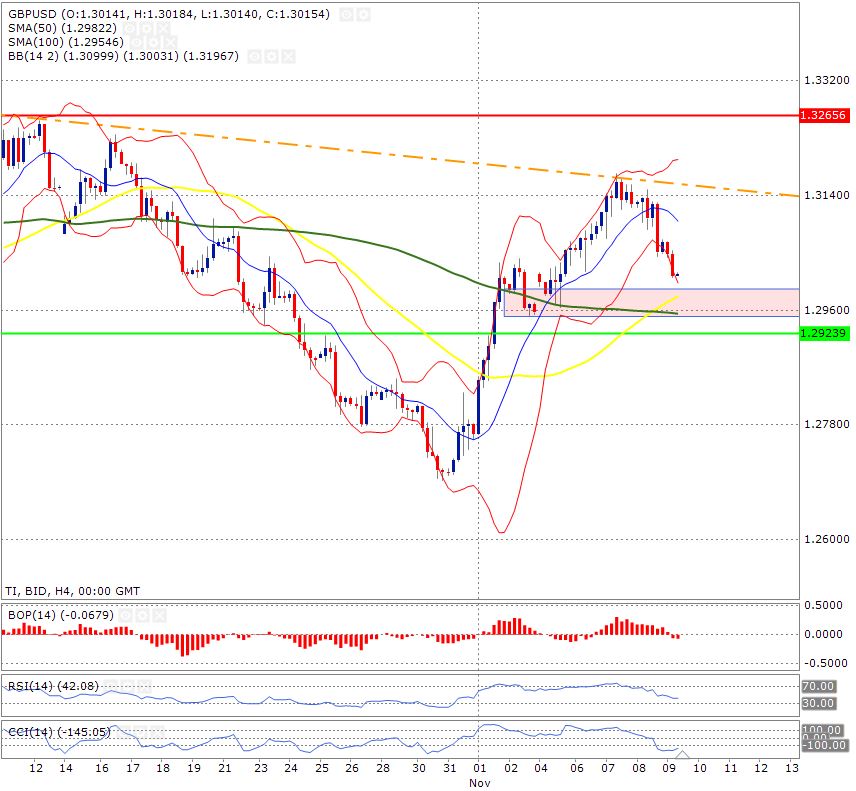
GBP/USD In A Freefall
The GBP/USD pair is facing a sharp sell-off on a 4-hour time frame. The price volatility is high as the price has pierced the Bollinger Band. But, an important thing is that the 50-day moving average (shown in yellow) has moved above the 100-day moving average (shown in green) and this is a bullish sign. Of course if the 50—day moving average falls below the 100-day moving average than all bets are off. For the bulls to show that they do have strength, we need the price to break above the downward trend line (shown in orange). The red rectangle area on the chart shows a small area of support and this is could actually push the price back up before it tests its major support mentioned below.
The Balance of power is confirming that the bears have lost control of the price. The Relative strength indicator is moving closer towards its oversold zone but it is still away from the extreme level of 30 which usually calls for a corrective move. Perhaps, the price still has a little more room to go before we that snap back reaction.
The support zone is shown by the horizontal green line-1.2939
The resistance zone is shown by the horizontal red line – 1.32656
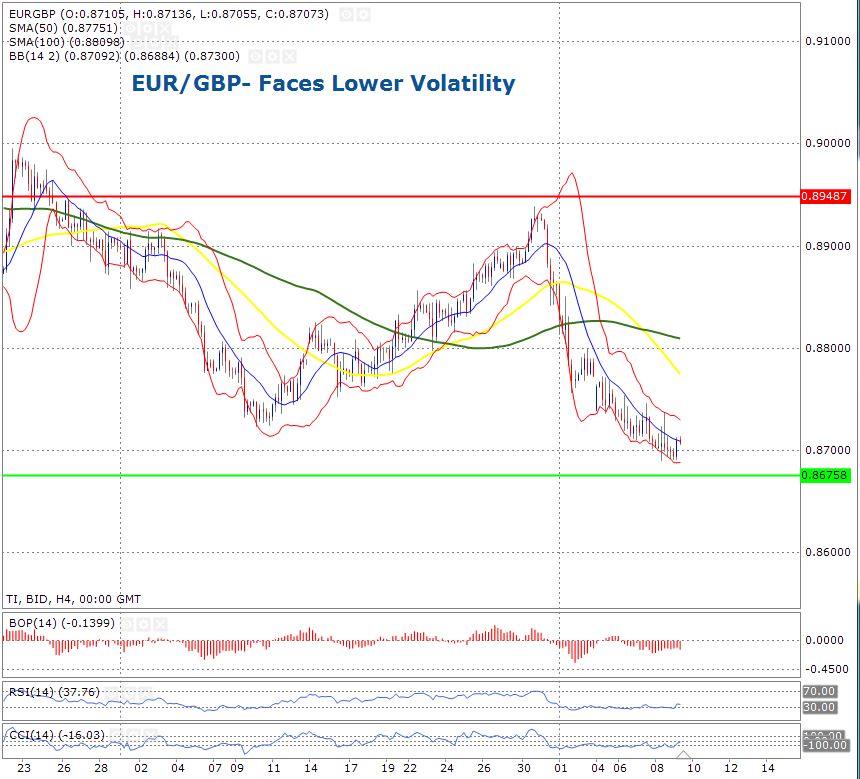
EUR/GBP- Faces Lower Volatility
The EUR/GBP pair is trading with the Bollinger band on a 4-hour time frame and this gives us the confirmation that there is very little to no volatility for the pair. In terms of trend, the price is clearly moving downward and it is also trading below the two critical moving averages; 50-day and 100-day moving averages. They are shown in yellow and green colour respectively. The bears are in control of the price and the confirmation of this comes from the Balance of power indicator as it is trading below the 0. When the bars are below 0, it shows that the bears are in control of the price and when the bars are above 0, it confirms that the bulls are in control of the price.
The RSI is trading near an extreme oversold level of 30 and this presents an opportunity for the price of the pair to move higher. Technical traders usually consider the RSI reading of 30 as a bull signal.
The support zone is shown by the horizontal green line- 0.8758
The resistance zone is shown by the horizontal red line – 0.89487