
Key Highlights
- Crude oil price extended losses and traded below the key $60.00 support against the US dollar.
- There was a break below a crucial declining channel with support at $58.00 on the 4-hours chart of XTI/USD.
- The US CPI in Oct 2018 increased 0.3% (MoM), similar to the forecast.
- Today, the US Retail Sales for Oct 2018 will be released, which is forecasted to increase 0.5% (MoM).
Crude Oil Price Technical Analysis
During the past few days, there were continuous losses in crude oil price below the $65.00 support against the US Dollar. The price recently settled below the key $60.00 support and traded to a new bi-monthly low.
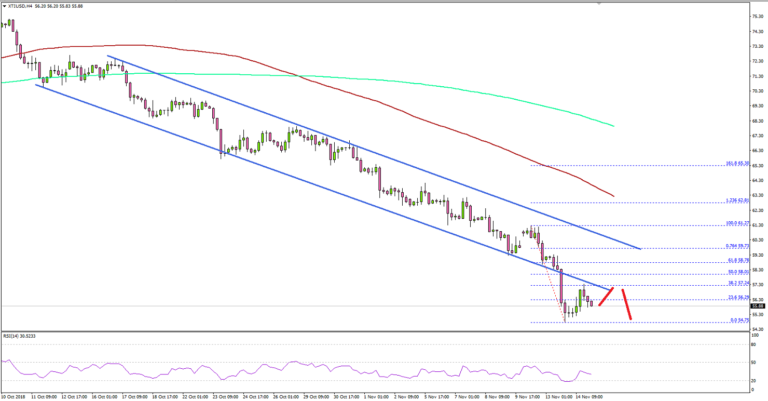
Looking at the 4-hours chart of XTI/USD, the price followed a major downtrend from the $74.00 swing high and broke many important supports such as $70.00, $65.00, $62.00, $60.00 and $58.00.
More importantly, there was a break below a crucial declining channel with support at $58.00. Besides, the price even traded below the $56.00 level and it is currently positioned well below the 100 (red) simple moving average (4-hours).
It traded close to the $54.00 level and it is currently consolidating losses. An initial resistance is near the $58.00 level the 50% Fib retracement level of the recent decline from the $61.27 high to $54.75 low.
Above $58.00, the main hurdle for buyers could be $60.00 and the 76.4% Fib retracement level of the recent decline from the $61.27 high to $54.75 low. To start a decent rebound, the price must trade above $60.00 in the near term.
On the downside, if there are further losses below $54.00, the price may perhaps trade towards the next major support at $50.00 in the near term.
Fundamentally, the US Consumer Price Index for Oct 2018 was released by the US Bureau of Labor Statistics. The market was looking for an increase of 0.3% in the CPI in Oct 2018 compared with the previous month.
The actual result was in line with the forecast and even the yearly change was +2.5%, similar to the forecast. However, the Core CPI in the US increased 2.1% (YoY), less than the forecast of +2.2%.
In the short term, there could be an upward move in crude oil price, but it won’t be easy for buyers to surpass the $58.00 and $60.00 resistances.
Economic Releases to Watch Today
- UK Retail Sales for Oct 2018 (MoM) – Forecast +0.2%, versus -0.8% previous.
- UK Retail Sales ex-fuel for Oct 2018 (MoM) – Forecast +0.5% versus -0.1% previous.
- US Initial Jobless Claims – Forecast 212K, versus 214K previous.
- US Import Price Index Oct 2018 (MoM) – Forecast +0.1%, versus +0.5% previous.
- US Export Price Index Oct 2018 (MoM) – Forecast +0.1%, versus 0% previous.
- US Retail Sales Oct 2018 (MoM) – Forecast +0.5%, versus +0.1% previous.


