
The EUR/USD currency pair
Technical indicators of the currency pair:
Prev Open: 1.14520
Open: 1.13648
% chg. over the last day: -0.71
Day’s range: 1.13571 – 1.14017
52 wk range: 1.1299 – 1.2557
EUR/USD started to descend. The demand for the risky assets is weakened. Yesterday the EUR/USD quotes fell by more than 85 points, updating the local minimums. At the moment EUR is testing 1.14000 level, which became a mirror resistance. The key support is 1.13650. We expect important economic reports from the US. Positions should be opened from the key levels.
The News Feed for 2018.11.21
Core Durable Goods Orders (US) – 15:30 (GMT+2:00);
Secondary Real Estate Reports (US) – 17:00 (GMT+2:00).
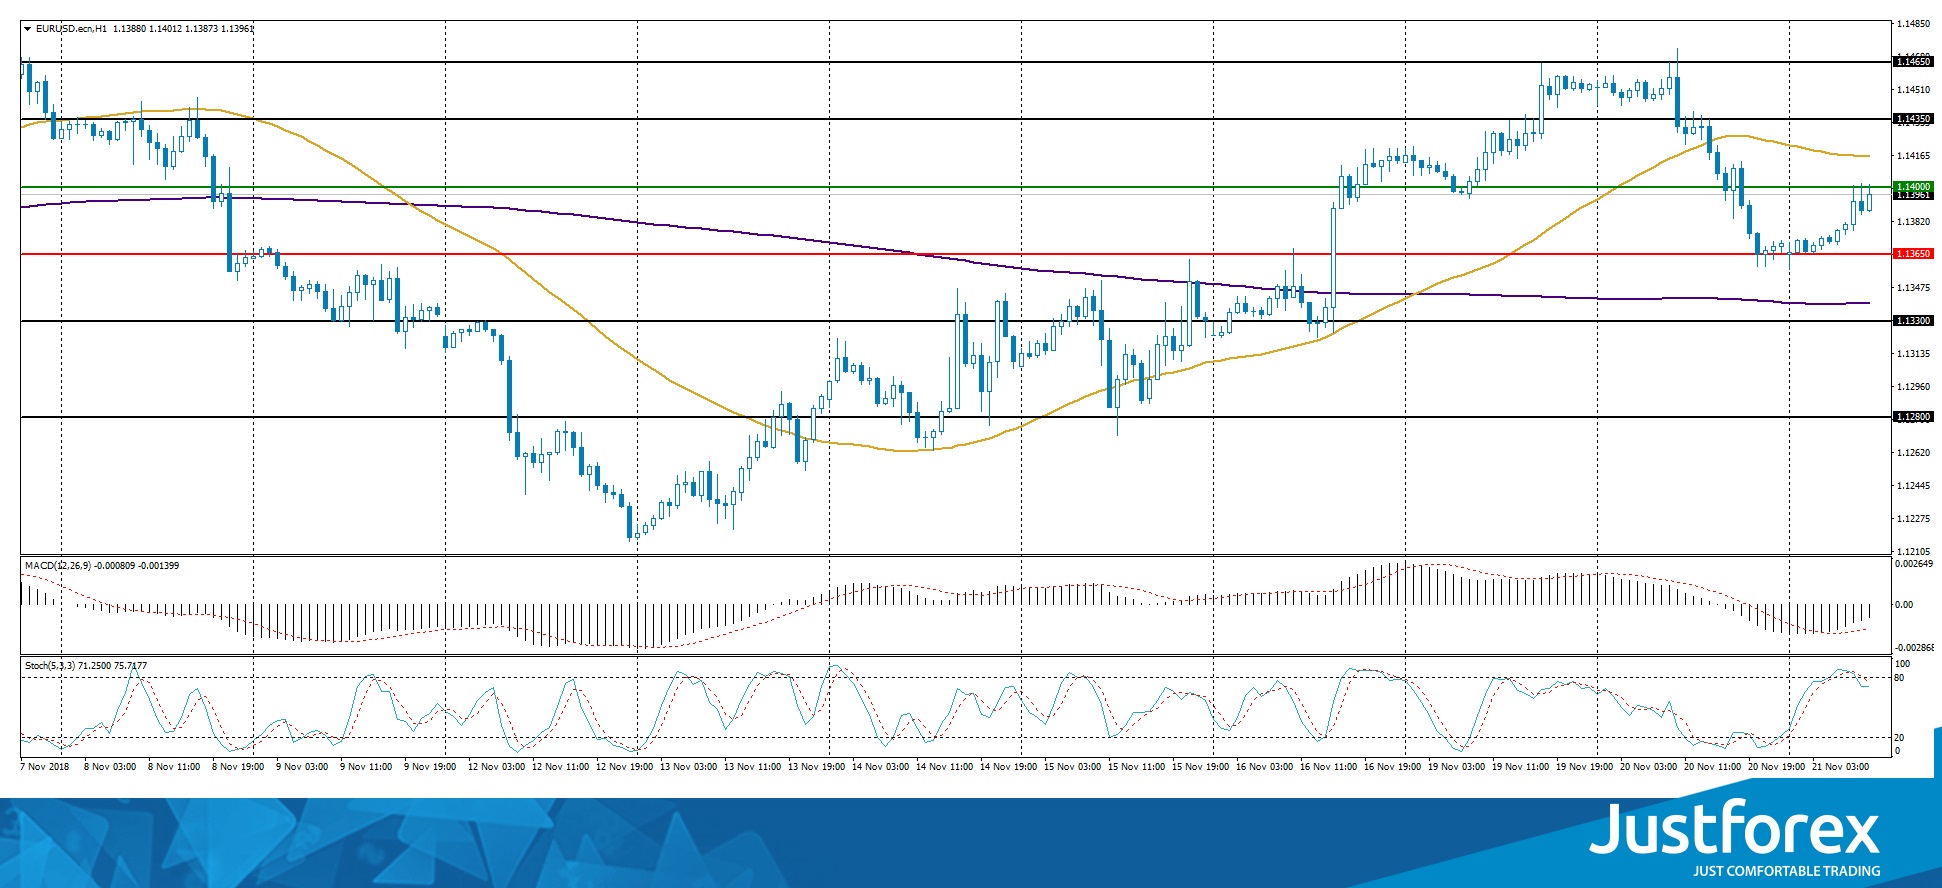
The indicators point toward the power of the buyers, the price fixed above 50 MA and 200 MA.
The MACD histogram is in the positive zone but below the signal line, which give a weak signal towards the purchase of EUR/USD.
The Stochastic Oscillator is in the neutral zone, the %K line is above the %D line, which indicates a bullish sentiment.
Trading recommendations
Support levels: 1.14350, 1.14000, 1.13650
Resistance levels: 1.14750, 1.15000
If the price fixes above 1.14750, expect further growth. Potentially towards 1.15000-1.15200.
Alternatively, the movement will correct toward 1.14200-1.14000.
The GBP/USD currency pair
Technical indicators of the currency pair:
Prev Open: 1.28440
Open: 1.28470
% chg. over the last day: +0.16
Day’s range: 1.28330 – 1.28808
52 wk range: 1.2662 – 1.4378
GBP/USD keeps trading in flat. There is no single trend here. The support and resistance levels are 1.28250 and 1.28850. Financial market participants wait for new data regarding Brexit. Positions should be opened from the key levels.
You should keep an eye on the statements by the Head of the Bank of England.
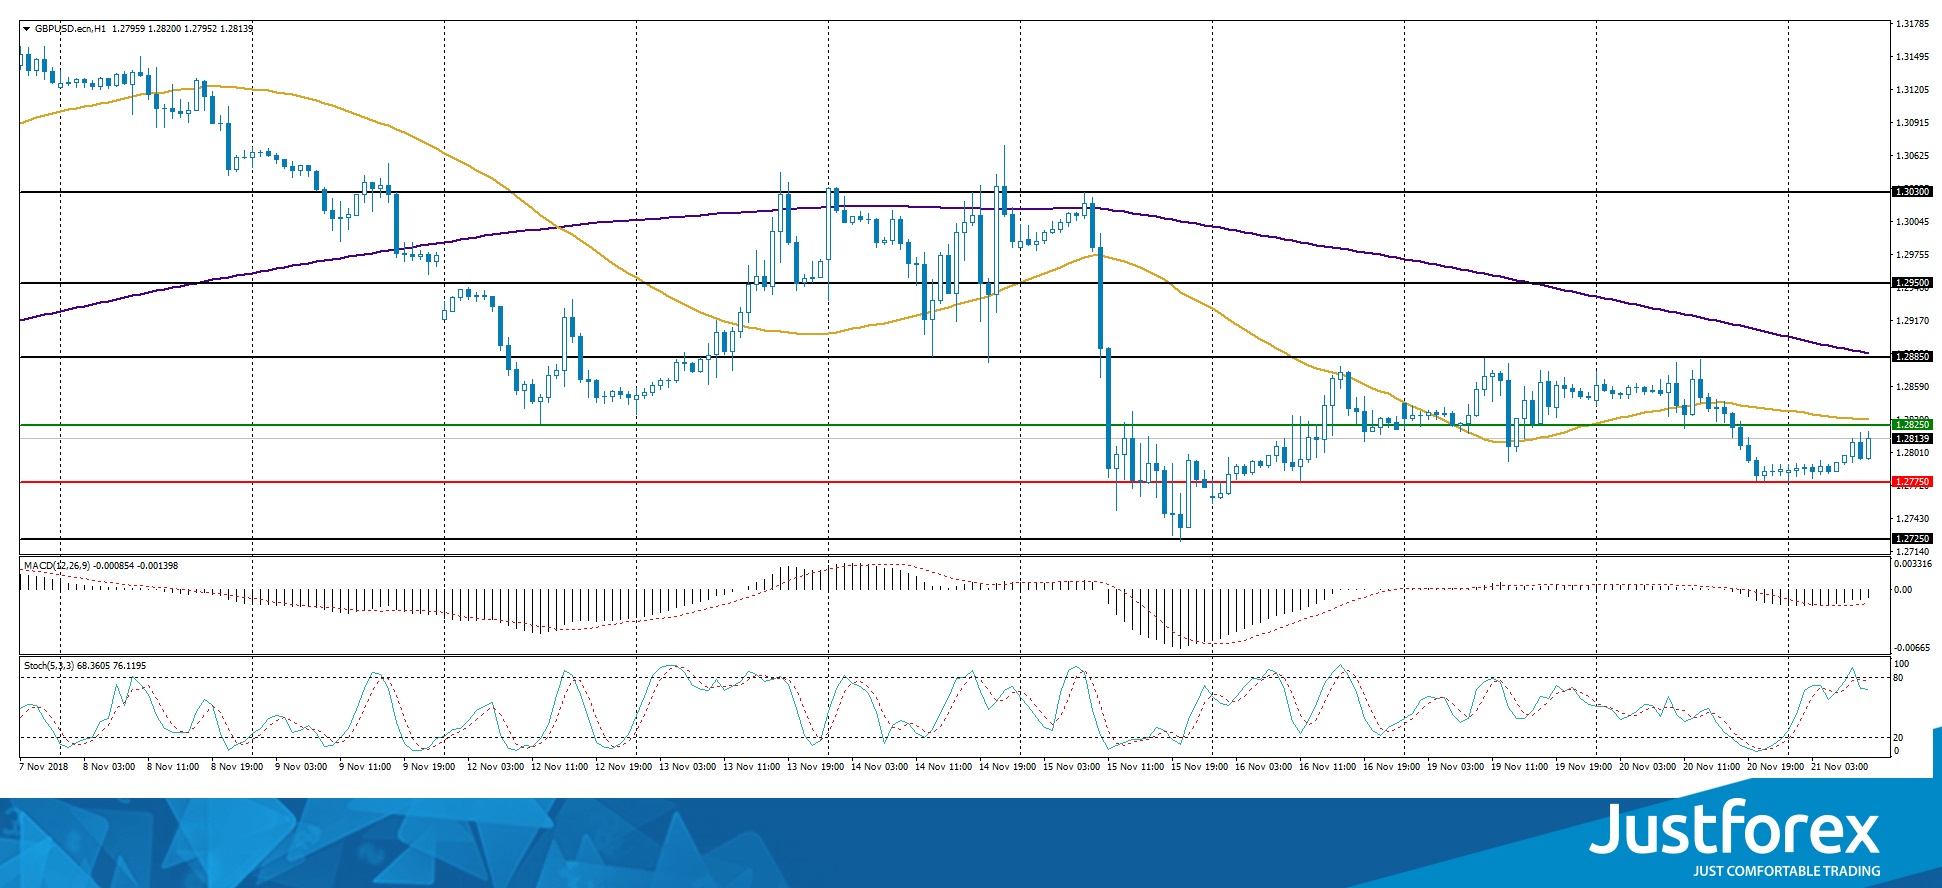
The price is below 50 MA and 200 MA, which indicates the power of the sellers.
The MACD histogram is in the red, but above the signal line, which gives a weak signal towards the sale of GBP/USD.
The Stochastic Oscillator is in around the overbought zone, the %K line started to cross the %D line. There are no signals at the moment.
Trading recommendations
Support levels: 1.28250, 1.27750, 1.27250
Resistance levels: 1.28250, 1.28850, 1.29500
If the price fixes below the support 1.27750, expect further descend of the quotes toward 1.27250-1.27000.
Alternatively, the quotes can grow towards the round 1.28700-1.29000..
The USD/CAD currency pair
Technical indicators of the currency pair:
Prev Open: 1.31693
Open: 1.32920
% chg. over the last day: +1.02
Day’s range: 1.32809 – 1.33174
52 wk range: 1.2248 – 1.3387
CAD also weakened against USD yesterday. The USD/CAD quotes grew by 150 points and almost reached the annual maximums. It happened due to the fall of the quotes on oil, wince WTI futures lost 5.5% of their value. At the moment the currency pair is consolidating around 1.32800-1.33150. Positions should be opened from the key levels.
At 15:30(GMT+2) Canada will publish a Wholesale Sales Report.
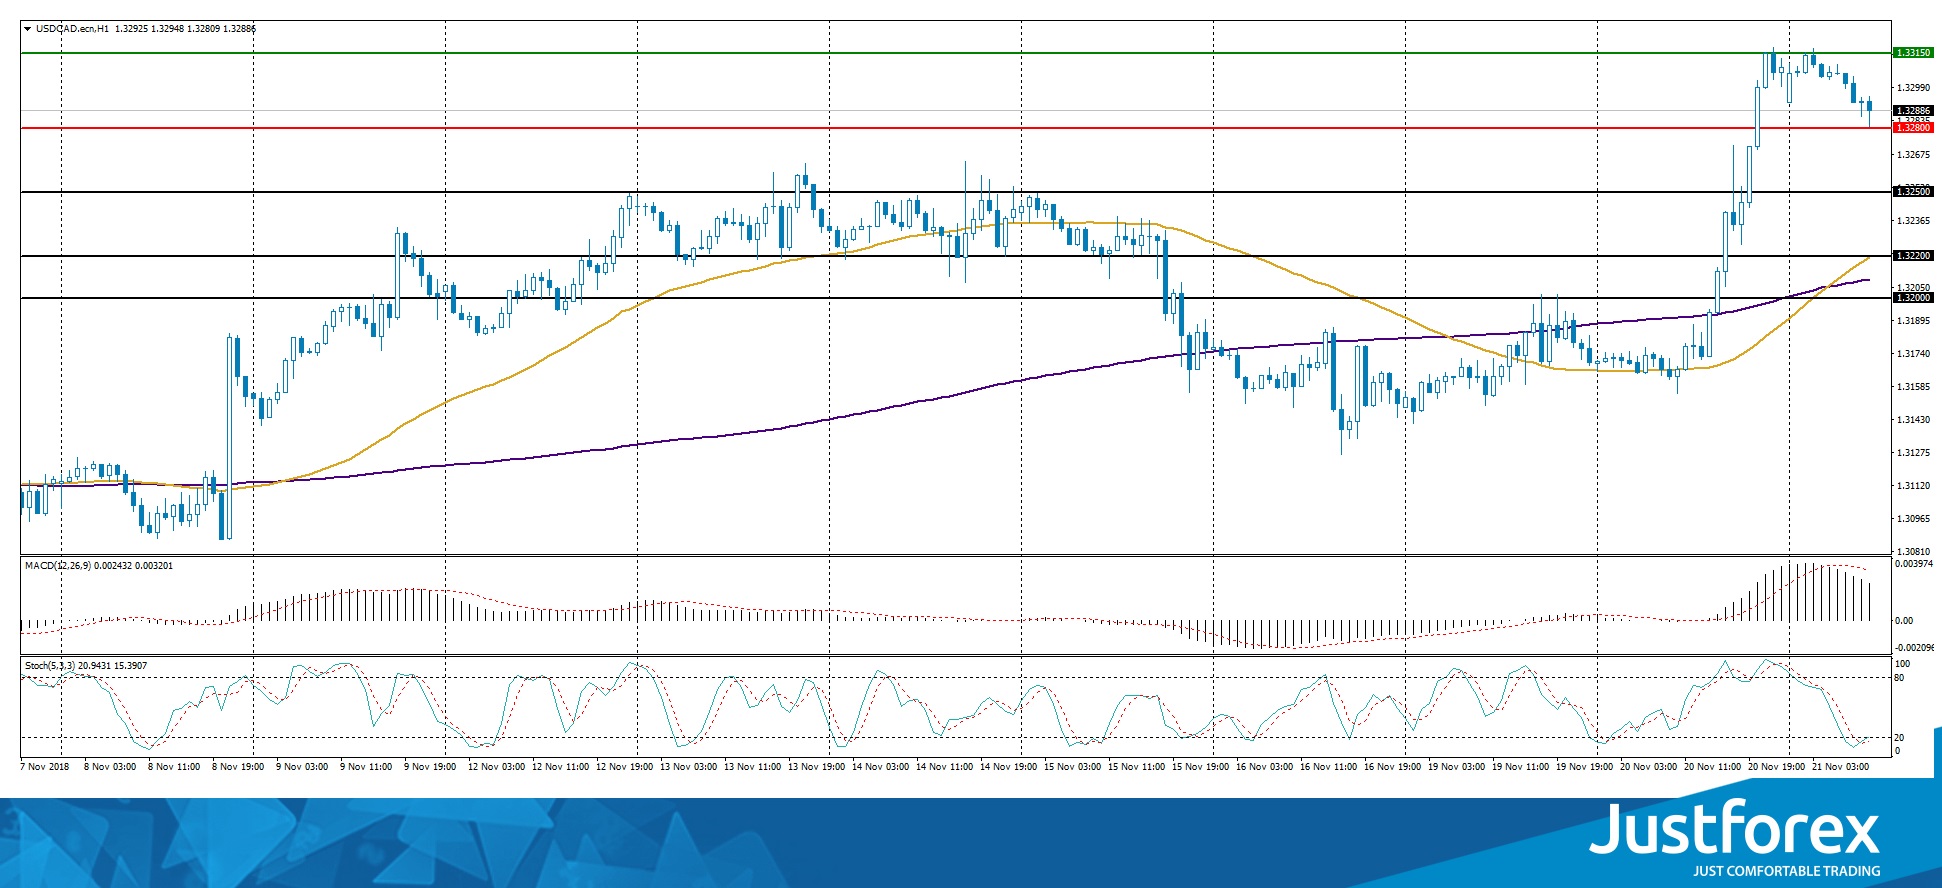
The price fixed above 50 MA and 200 MA, which indicates a bullish mood.
The MACD histogram is in the greed but below the signal line, which provides a weak signal towards a purchase of USD/CAD.
The Stochastic Oscillator is in the oversold zone, the %K line crosses the %D line. There are no signals at the moment.
Trading recommendations
Support levels: 1.32800, 1.32500, 1.32200
Resistance levels: 1.33150, 1.33500, 1.33850
If the price fixes above the resistance level 1.33150, consider buying USD/CAD. The movement will tend toward the round 1.33500-1.33800.
Alternatively, the currency pair can correct to 1.32500-1.32300.
The USD/JPY currency pair
Technical indicators of the currency pair:
Prev Open: 112.517
Open: 112.744
% chg. over the last day: +0.13
Day’s range: 112.644 – 112.938
52 wk range: 104.56 – 114.74
The USD/JPY quotes started to grow. At the moment the safe haven currency is testing the resistance level of 112.900. 112.650 is the mirror support. The investors expect important economic reports from the US. We recommend you keep an eye on the trends regarding the US Treasury bonds. Positions should be opened from the key levels.
The news feed is calm for today.
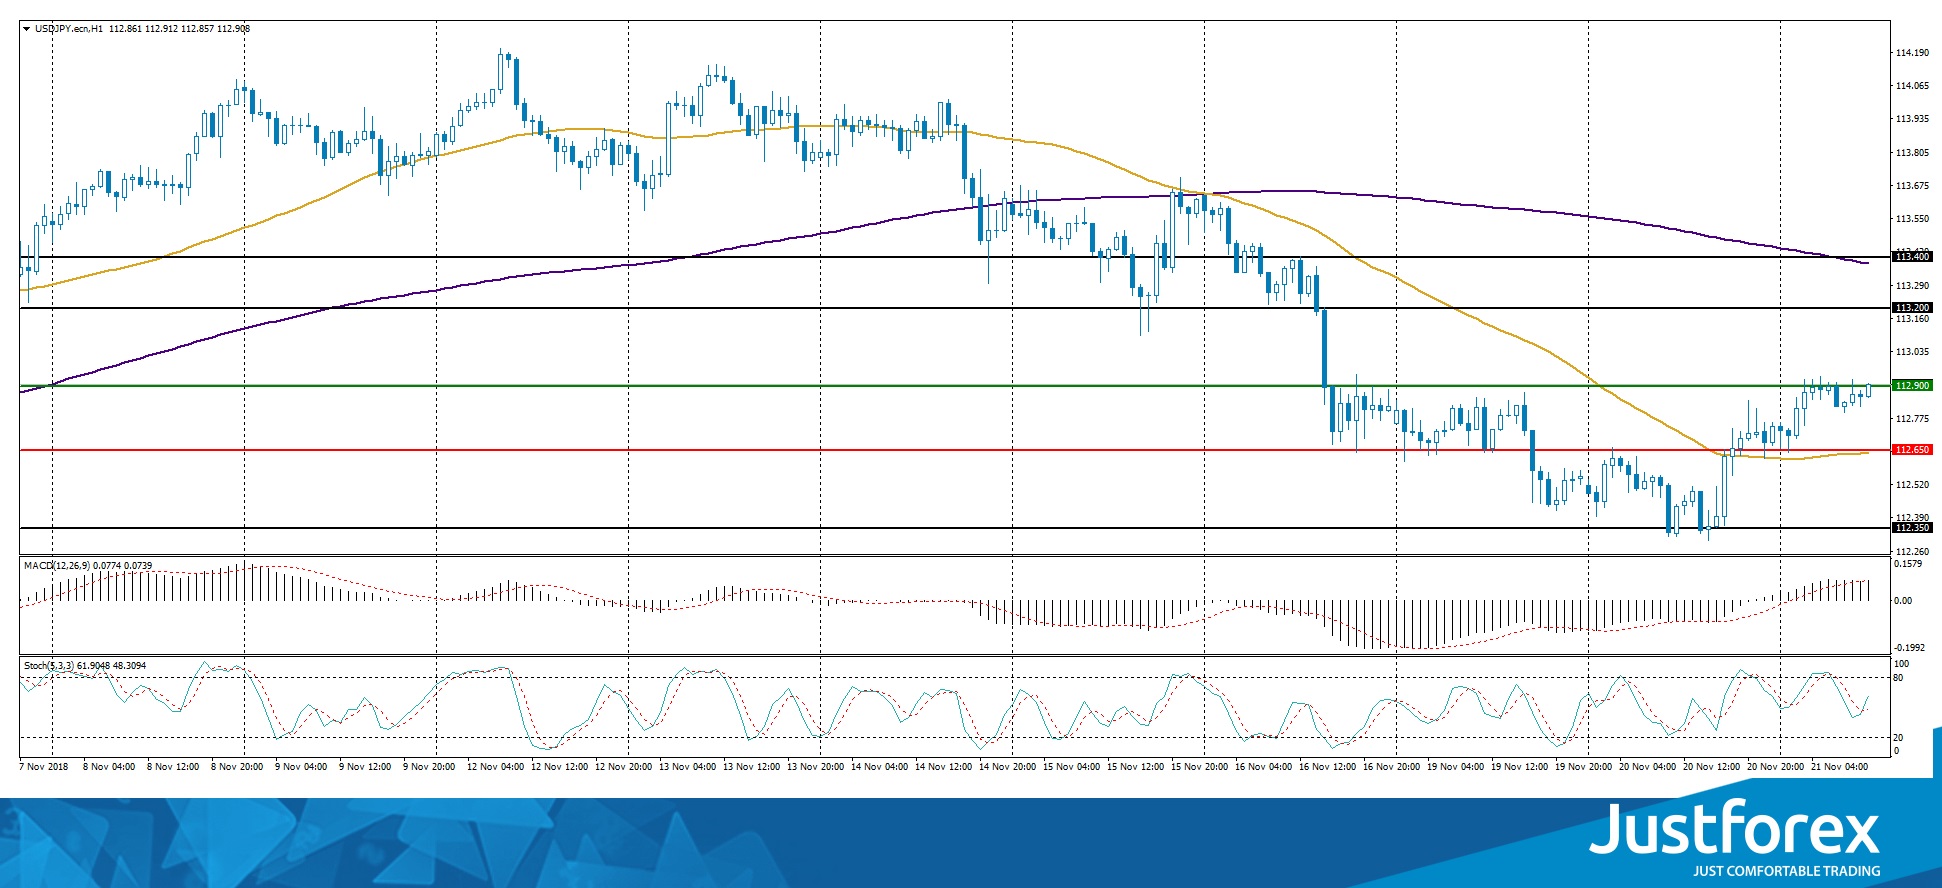
The price is between 50 MA and 200 MA, indicators do not provide signals.
The MACD histogram is in the positive zone and keeps rising, which give a strong signal towards the purchase of USD/JPY.
The Stochastic Oscillator is in the neutral zone, the %K line crosses the %D line. There are no signals.
Trading recommendations
Support levels: 112.650, 112.350
Resistance levels: 112.900, 113.200, 113.400
If the price fixes above the resistance 112.900, expect a further growth of the quotes. The movement will tend toward 113.200-113.400.
Alternatively, USD/JPY can fall towards 112.500-112.350.


