The S&P500 index is under the influence of the bearish selling pressure but this could change.
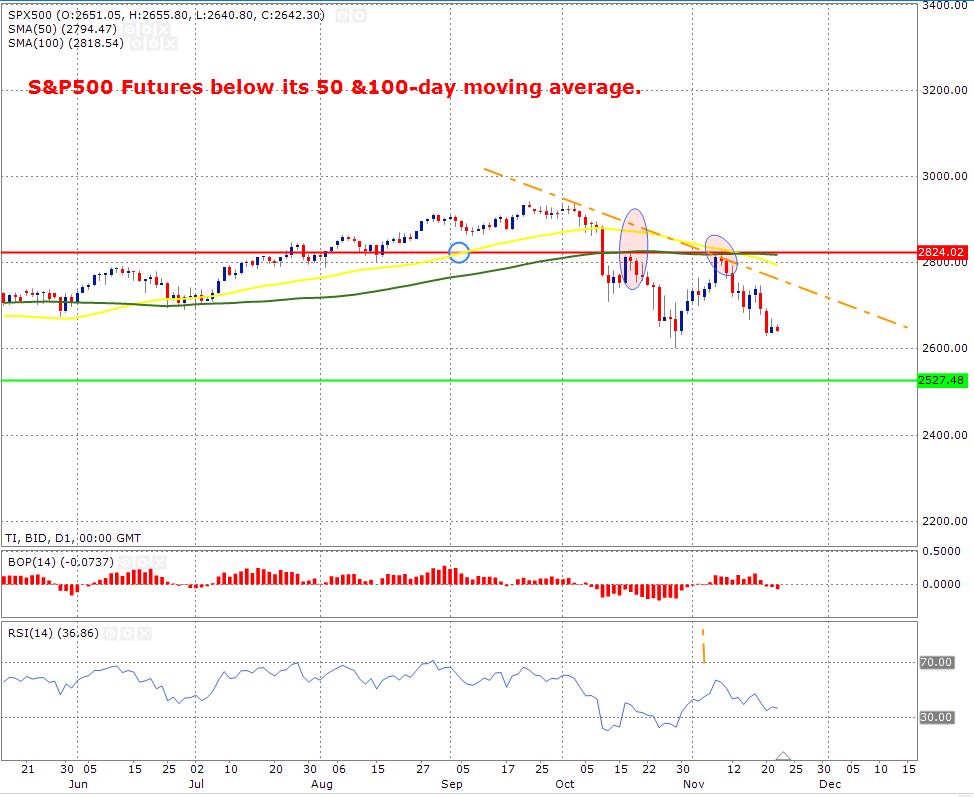
The S&P500 index is trading firmly below the downward trend line (shown n orange) on a daily time frame. The price formed a double top (shown by the two circles), this is a strong sell pattern. Statistically speaking, 90% of the time, the price moves lower after forming this pattern and this is what we have experienced in this case.
The balance of power shows that the bears have taken control of the price because the indicator is trading below the zero mark. The indicator further confirms that the momentum has shifted from the bulls to the bears. The RSI index is also confirming the same sentiment.
The 50-day moving average (shown in yellow) is trading below the 100-day moving average (shown in green), this provides another confirmation that the trend is skewed to the downside and the bulls need to break above the 50-day moving average to change the sentiment.
The support is shown by the green horizontal line.
The resistance is shown by the red horizontal line.