
The EUR/USD currency pair
Technical indicators of the currency pair:
Prev Open: 1.13648
Open: 1.13870
% chg. over the last day: +0.16
Day’s range: 1.13948 – 1.14020
52 wk range: 1.1299 – 1.2557
The EUR/USD currency pair is in a sideways trend. The technical pattern is ambiguous. Investors expect additional drivers. At the moment, the key support and resistance levels are 1.13800 and 1.14150, respectively. Positions should be opened from these marks. Today, trading volume and liquidity will be reduced due to Thanksgiving Day. We recommend reducing the risks when opening positions.
Investors expect the minutes of the ECB monetary policy meeting at 14:30 (GMT+2:00).
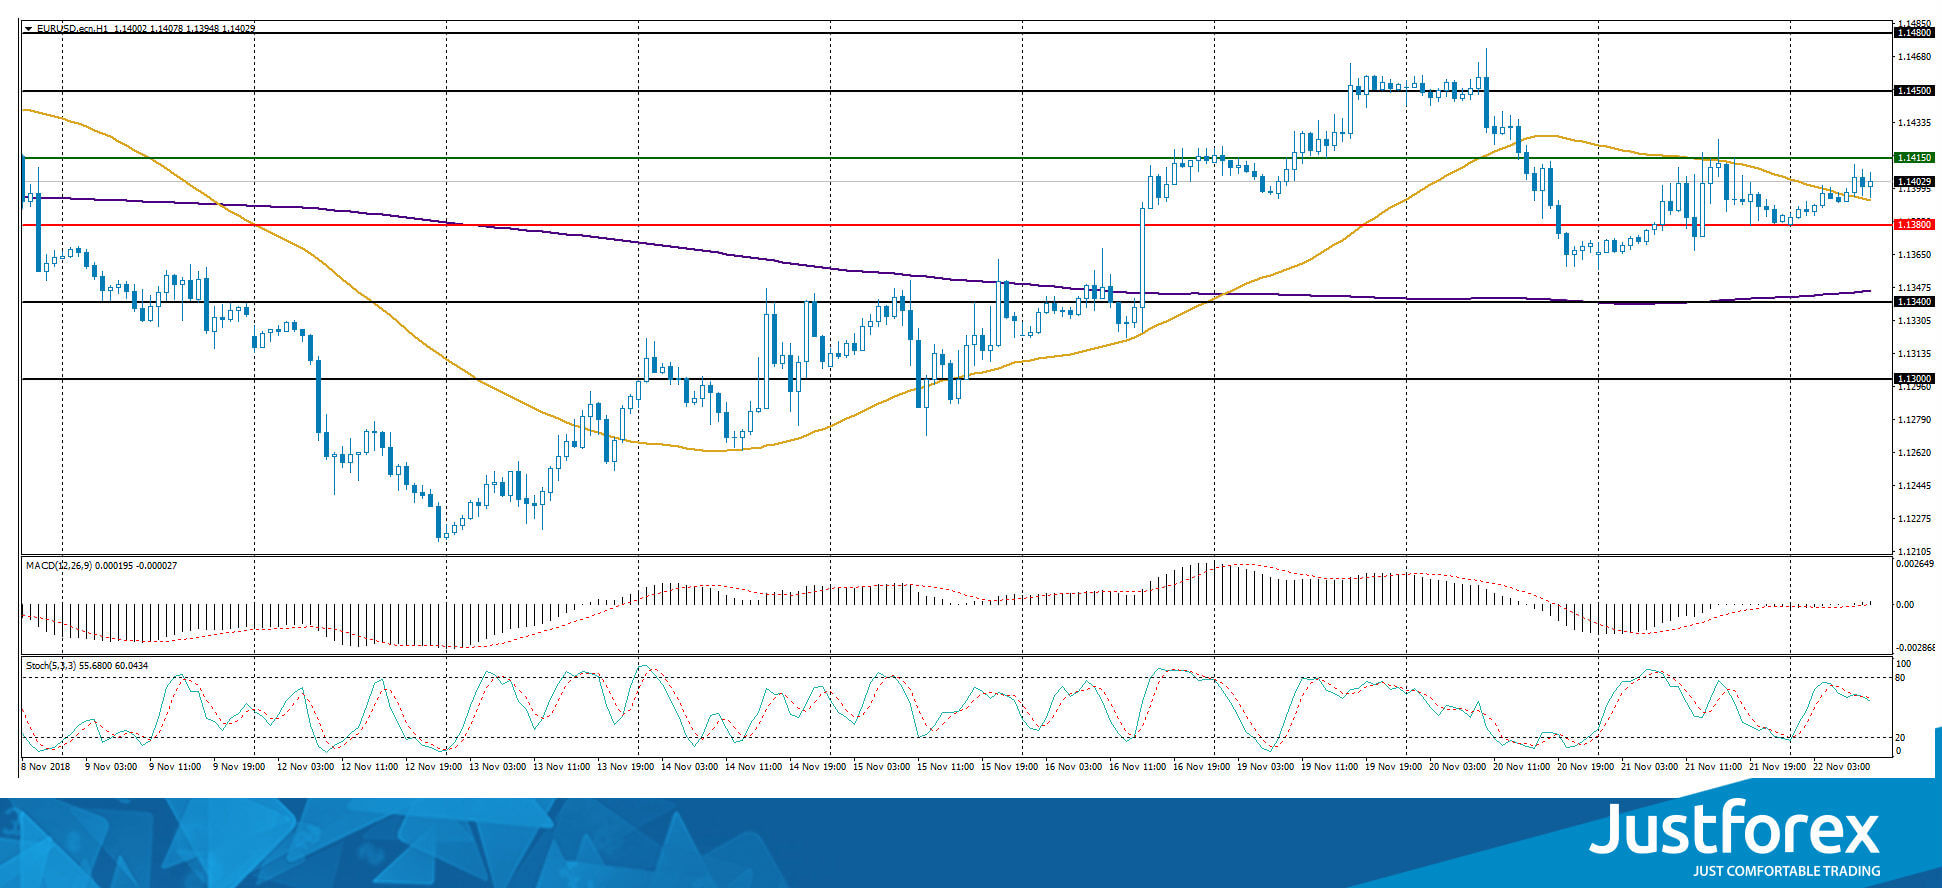
Indicators do not send accurate signals: the price has crossed 50 MA.
The MACD histogram is near the 0 mark.
Stochastic Oscillator is in the neutral zone, the %K line has crossed the %D line. There are no signals at the moment.
Trading recommendations
Support levels: 1.13800, 1.13400, 1.13000
Resistance levels: 1.14150, 1.14500, 1.14800
If the price fixes above the resistance level of 1.14150, it is necessary to consider purchases of EUR/USD. The movement is tending to 1.14500-1.14800.
An alternative may be a drop in the EUR/USD quotes to the level of 1.13400-1.13000.
The GBP/USD currency pair
Technical indicators of the currency pair:
Prev Open: 1.27834
Open: 1.27710
% chg. over the last day: -0.09
Day’s range: 1.27791 – 1.27908
52 wk range: 1.2662 – 1.4378
The technical pattern on the GBP/USD currency pair is ambiguous. At the moment, the trading instrument is consolidating. Investors expect additional drivers. The key range is 1.27600-1.28100. Positions should be opened from these marks.
Today the publication of important economic reports from the UK is not planned.
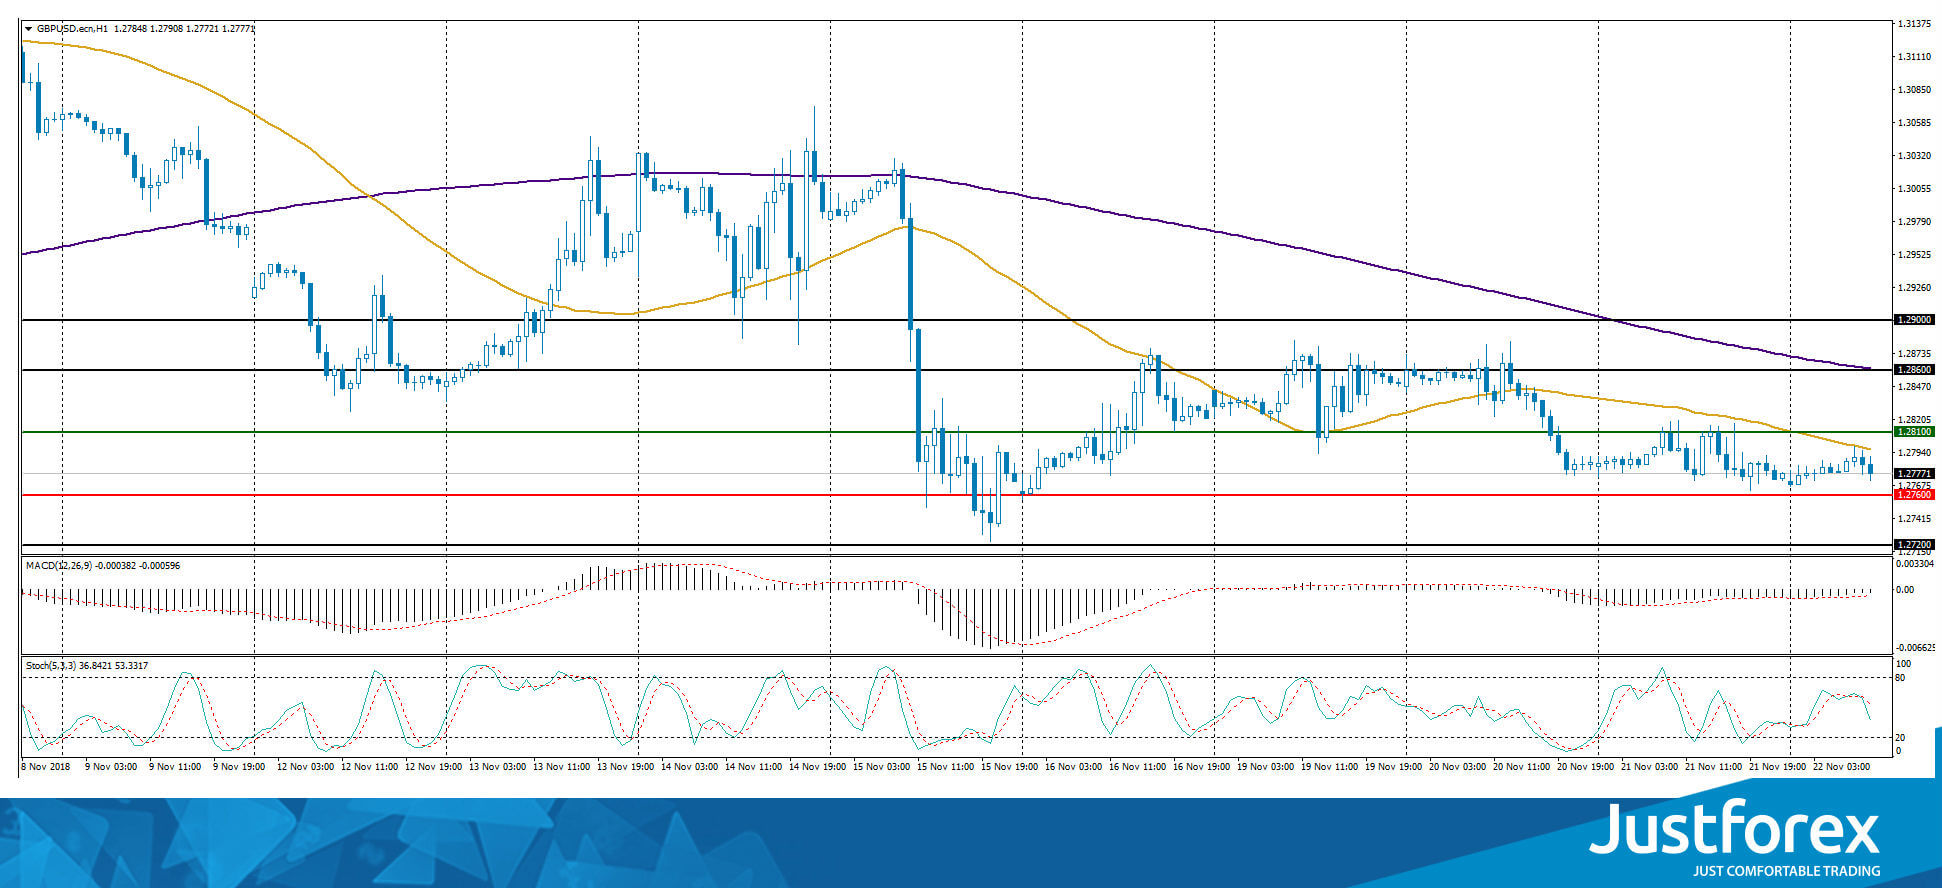
The price has fixed below 50 MA and 200 MA, which indicates the power of sellers.
The MACD histogram is located near the 0 mark. There are no accurate signals at the moment.
Stochastic Oscillator is in the neutral zone, the %K line is below the %D line, which indicates the bearish sentiment.
Trading recommendations
Support levels: 1.27600, 1.27200
Resistance levels: 1.28100, 1.28600, 1.29000
If the price fixes below the support level of 1.27600, the GBP/USD quotes are expected to fall. The movement is tending to 1.27200-1.27000.
An alternative may be the GBP/USD currency pair growth to 1.28400-1.28600.
The USD/CAD currency pair
Technical indicators of the currency pair:
Prev Open: 1.32920
Open: 1.32314
% chg. over the last day: -0.59
Day’s range: 1.32314 – 1.32452
52 wk range: 1.2248 – 1.3387
Yesterday, a technical correction was observed on the USD/CAD currency pair after a significant increase on Tuesday, November 20. Quotes fell by more than 80 points. At the moment, the loonie is consolidating in the range of 1.32250-1.32500. Positions should be opened from these marks. The trading instrument is tending to recover.
The news feed on the economy of Canada is calm.
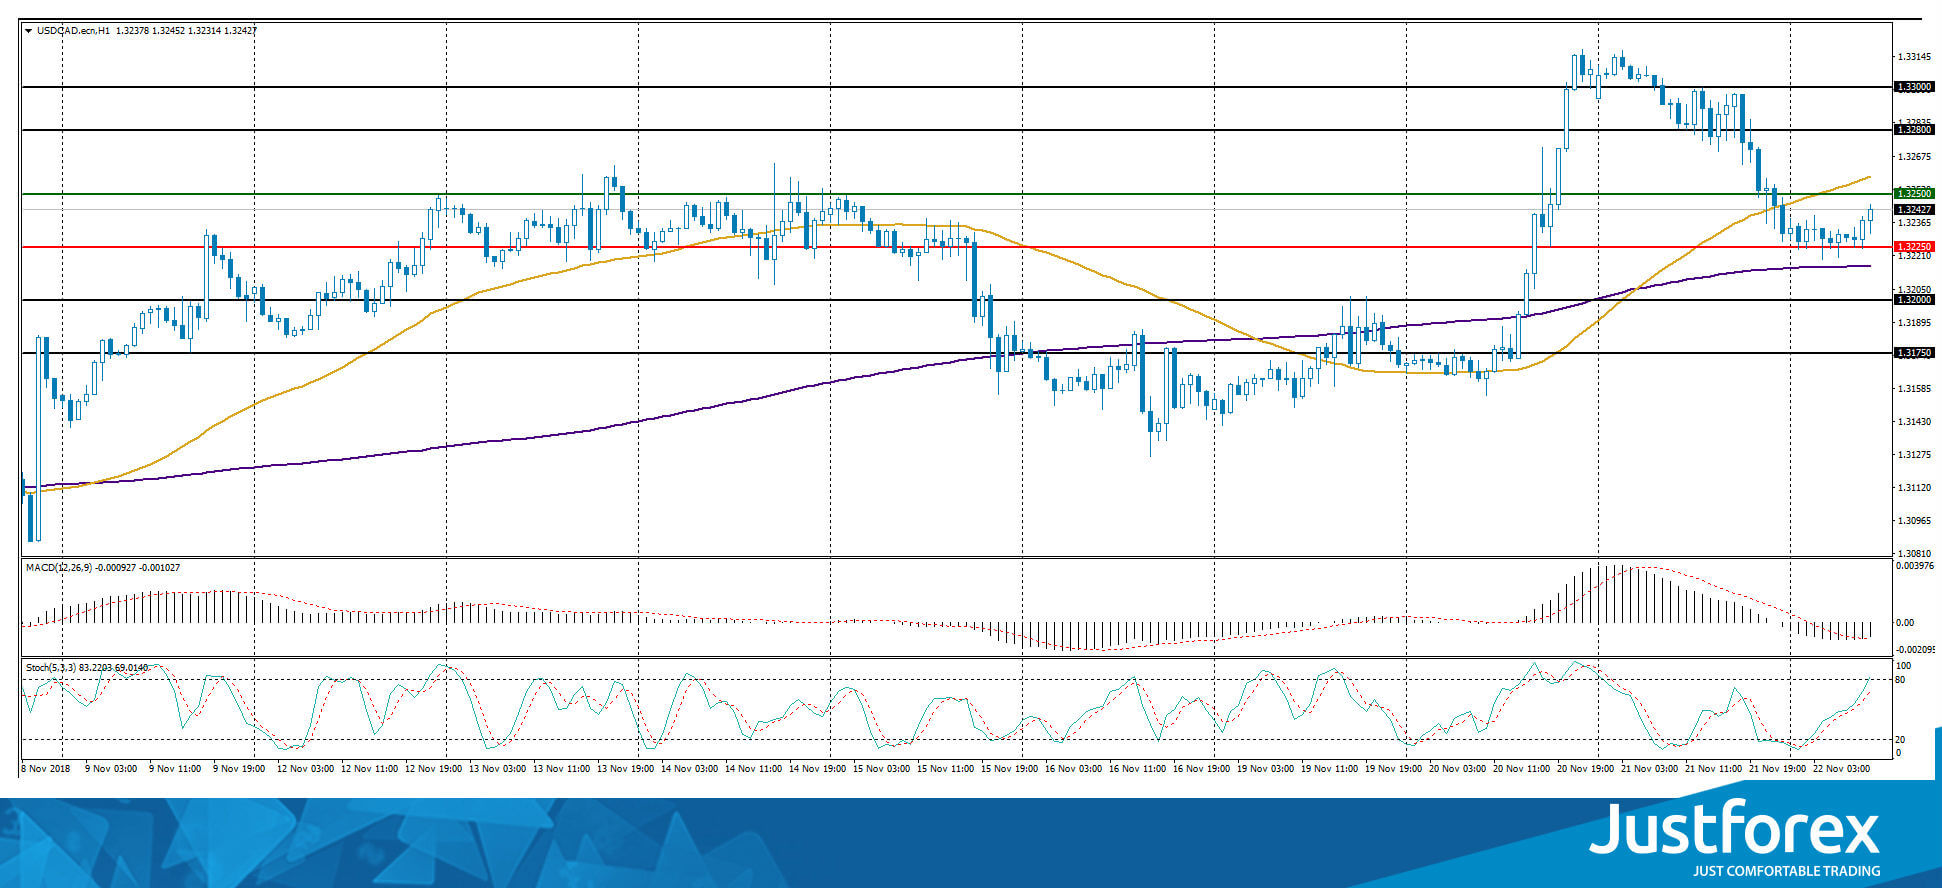
The price has fixed between 50 MA and 200 MA, which are dynamic support and resistance levels.
The MACD histogram is in the negative zone, but above the signal line, which gives a weak signal to sell USD/CAD.
Stochastic Oscillator is in the neutral zone, the %K line is above the %D line, which indicates the bullish sentiment.
Trading recommendations
Support levels: 1.32250, 1.32000, 1.31750
Resistance levels: 1.32500, 1.32800, 1.33000
If the price fixes above the resistance level of 1.32500, it is necessary to consider purchases of USD/CAD. The movement is tending to 1.32800-1.33000.
An alternative may be a further correction of the USD/CAD currency pair to 1.32000-1.31750.
The USD/JPY currency pair
Technical indicators of the currency pair:
Prev Open: 112.744
Open: 113.056
% chg. over the last day: +0.23
Day’s range: 112.885 – 112.928
52 wk range: 104.56 – 114.74
The technical pattern on the USD/JPY currency pair is ambiguous. At the moment, quotes are consolidating. The key support and resistance levels are 112.800 and 113.100, respectively. We recommend paying attention to the dynamics of the US government bonds. Positions should be opened from the key levels. The trading instrument is tending to decline.
Publication of important economic reports from Japan is not planned.
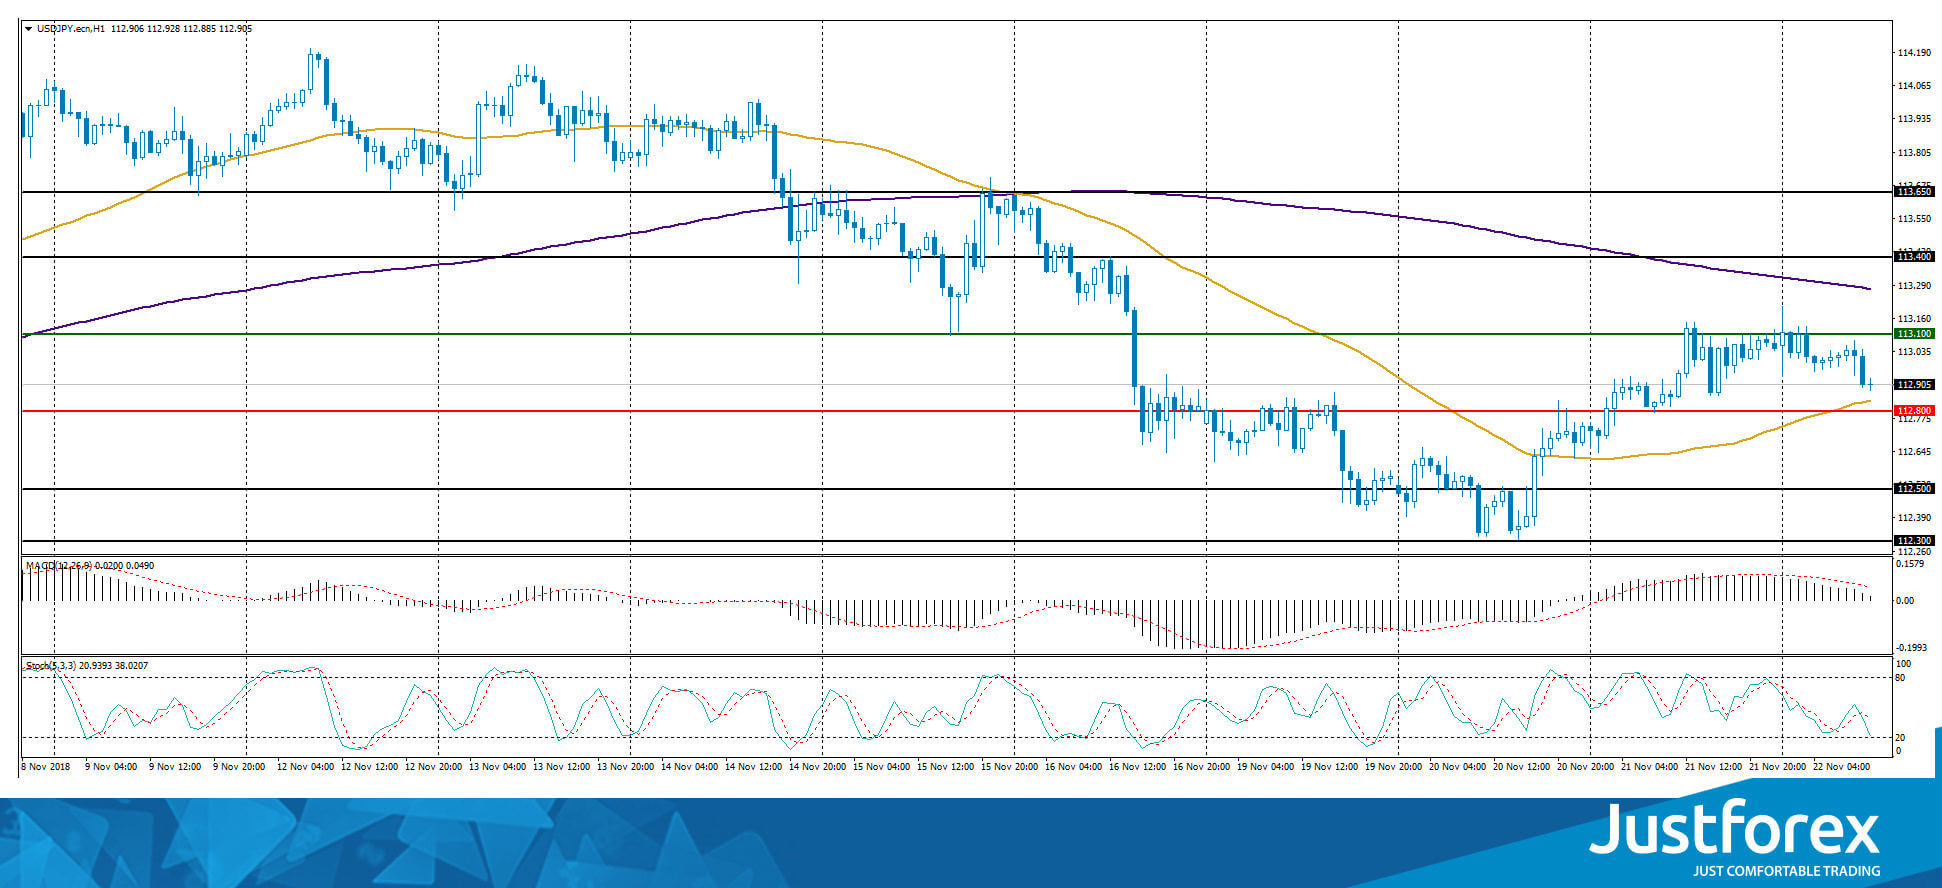
Indicators do not send accurate signals: the price has fixed between 50 MA and 200 MA.
The MACD histogram is located in the positive zone, but below the signal line, which gives a weak signal to buy USD/JPY.
Stochastic Oscillator is in the neutral zone, the %K line is below the %D line, which indicates the bearish sentiment.
Trading recommendations
Support levels: 112.800, 112.500, 112.300
Resistance levels: 113.100, 113.400, 113.650
If the price fixes below the support level of 112.800, the USD/JPY quotes are expected to fall. The movement is tending to 112.500-112.300.
An alternative may be the USD/JPY currency pair growth to 113.400-113.600.


