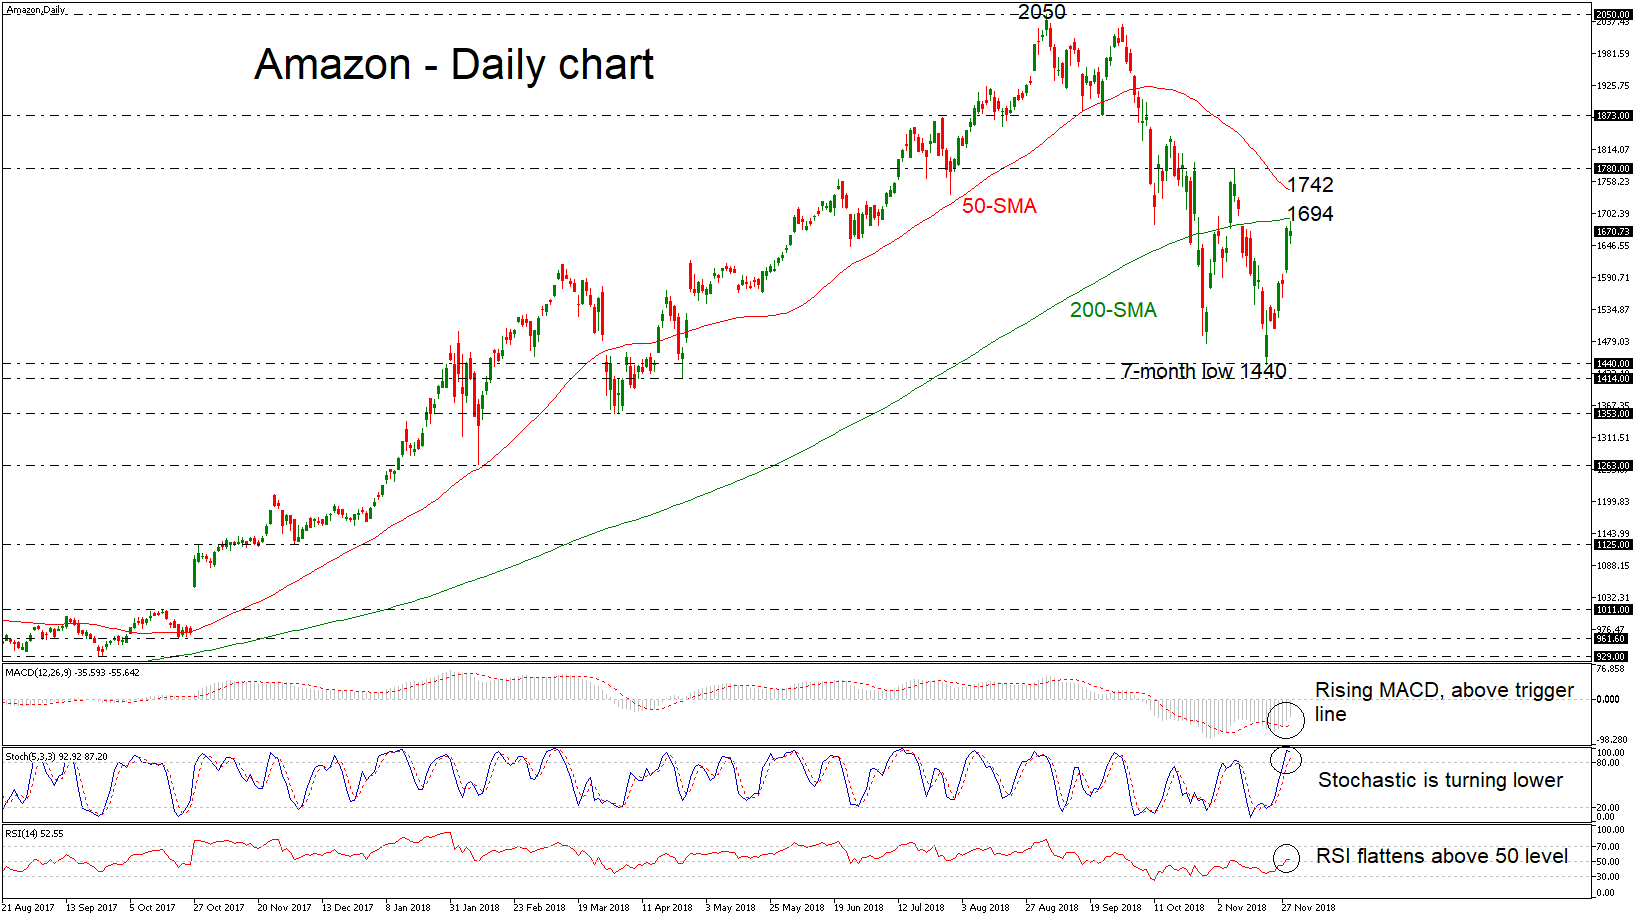
Amazon stock price rebounded after touching a seven-month low on November 20, however it still trades below the 200-day simple moving average (SMA). Having a look at the momentum indicators, they are giving mixed signals. On the one hand the MACD is reducing its negative momentum, while the stochastic is turning slightly lower in the overbought zone, signaling possible losses. Also, the RSI is flattening, marginally above the neutral threshold of 50.
Advances may stall initially near the 200-day SMA, which stands around yesterday’s high of 1694. A clear climb above this line, would send prices until the 50-day SMA near 1742 at the time of writing. Higher still, attention may shift to the 1780 resistance, before heading towards the 1873.00 barrier.
Another wave of declines may find support at the 1440 – 1414 area, with stronger downside moves aiming for the 1353 obstacle, taken from the lows on April 3.
Overall, as long as the stock remains below its 200-day SMA, the picture remains predominantly negative.