
The EUR/USD currency pair
Technical indicators of the currency pair:
Prev Open: 1.13827
Open: 1.13499
% chg. over the last day: -0.67
Day’s range: 1.13748 – 1.13838
52 wk range: 1.1299 – 1.2557
On Friday EUR/USD had a bearish mood. The quotes lowered by more than 70 points. Currently the currency pair is recovering. The local support and resistance are 1.13500 and 1.13800. Positions should be opened from these levels. The financial market participants are waiting for reports from the EU and the US.
The news feed on 03.12.2018:
Industrial Purchasing Managers’ Index (GER) – 10:55 (GMT+2:00);
Industrial Purchasing Managers’ Index (US) – 17:00 (GMT+2:00);
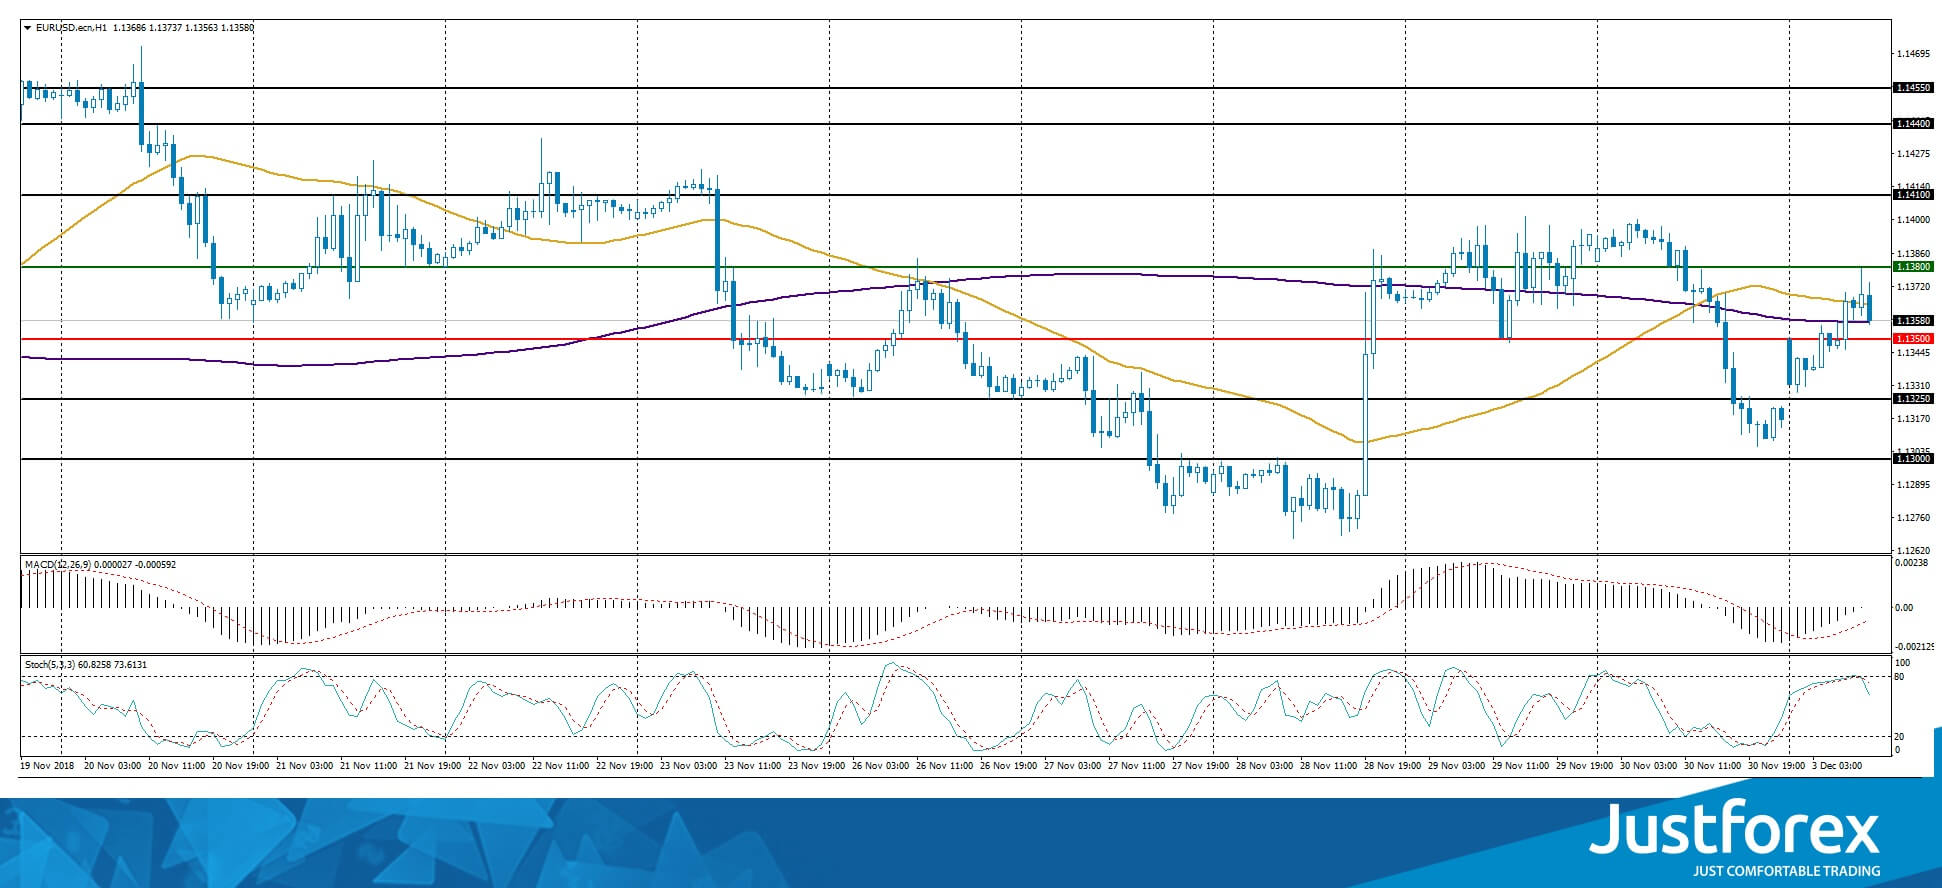
Indicators do not provide precise signals, the price has crossed 50 MA and 200 MA.
The MACD histogram is close to 0.
Stochastic Oscillator is located in the neutral zone, the %K line is crossing the %D line. There are no precise signals.
Trading recommendations
Support levels: 1.13500, 1.13250, 1.13000
Resistance levels: 1.13800, 1.14100, 1.14400
If the price fixes above 1.13800, the EUR/USD quotes are expected to grow. The movement is tending to 1.14100-1.14400.
An alternative may be a decrease in the EUR/USD currency pair to the level of 1.13250-1.13000.
The GBP/USD currency pair
Technical indicators of the currency pair:
Prev Open: 1.27821
Open: 1.27291
% chg. over the last day: -0.33
Day’s range: 1.27916 – 1.28248
52 wk range: 1.2662 – 1.4378
The technical picture of the GBP/USD is still ambiguous. The pound is trading in flat. The financial market participants are waiting for the additional drivers. At the moment, the local support and resistance levles are 1.27700 and 1.28100 respectively. Positions should be opened from these levels.
At 11:30 (GMT+2:00) the Industrial PMI index will be published in UK.
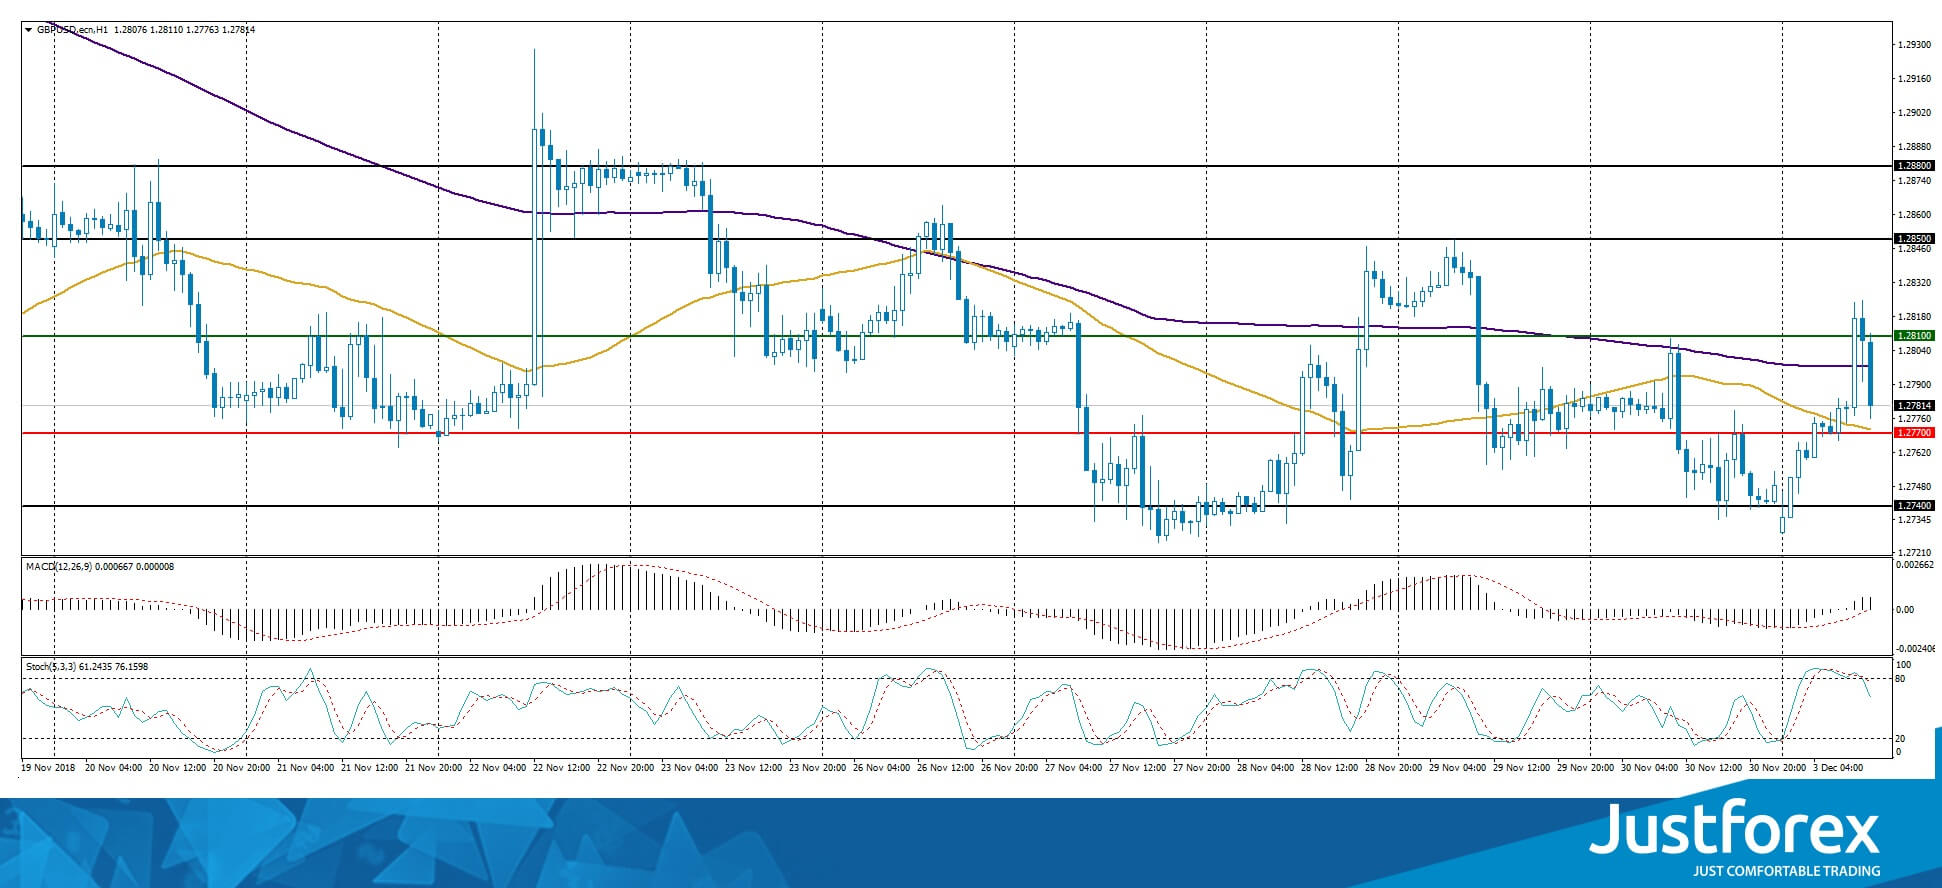
Indicators do not send accurate signals: the price has crossed 50 MA and 200 MA.
The MACD histogram is in the positive zone, which indicates a bullish mood.
Stochastic Oscillator is leaving the overbought zone, the %K line is below the %D line, which sends a signal to sell GBP/USD.
Trading recommendations
Support levels: 1.27700, 1.27400
Resistance levels: 1.28100, 1.28500, 1.28800
If the price fixes below the support level of 1.27700, the GBP/USD quotes are expected to decline. The movement is tending to 1.27400-1.27000.
An alternative may be the GBP/USD currency pair growth to 1.28500-1.28800.
The USD/CAD currency pair
Technical indicators of the currency pair:
Prev Open: 1.32793
Open: 1.32359
% chg. over the last day: +0.10
Day’s range: 1.31672 – 1.31731
52 wk range: 1.2248 – 1.3387
USD/CAD is seeing some aggressive sales. CAD has strengthened against the USD by more than 100 points and the currency pair has updated the local minimums. It is supported by the growth of the oil quotes. The local support and resistance levels are 1.31600 and 1.31850. Positions should be opened from these levels. The trading instrument has a tendency to decrease.
The newsfeed for Canada is calm.
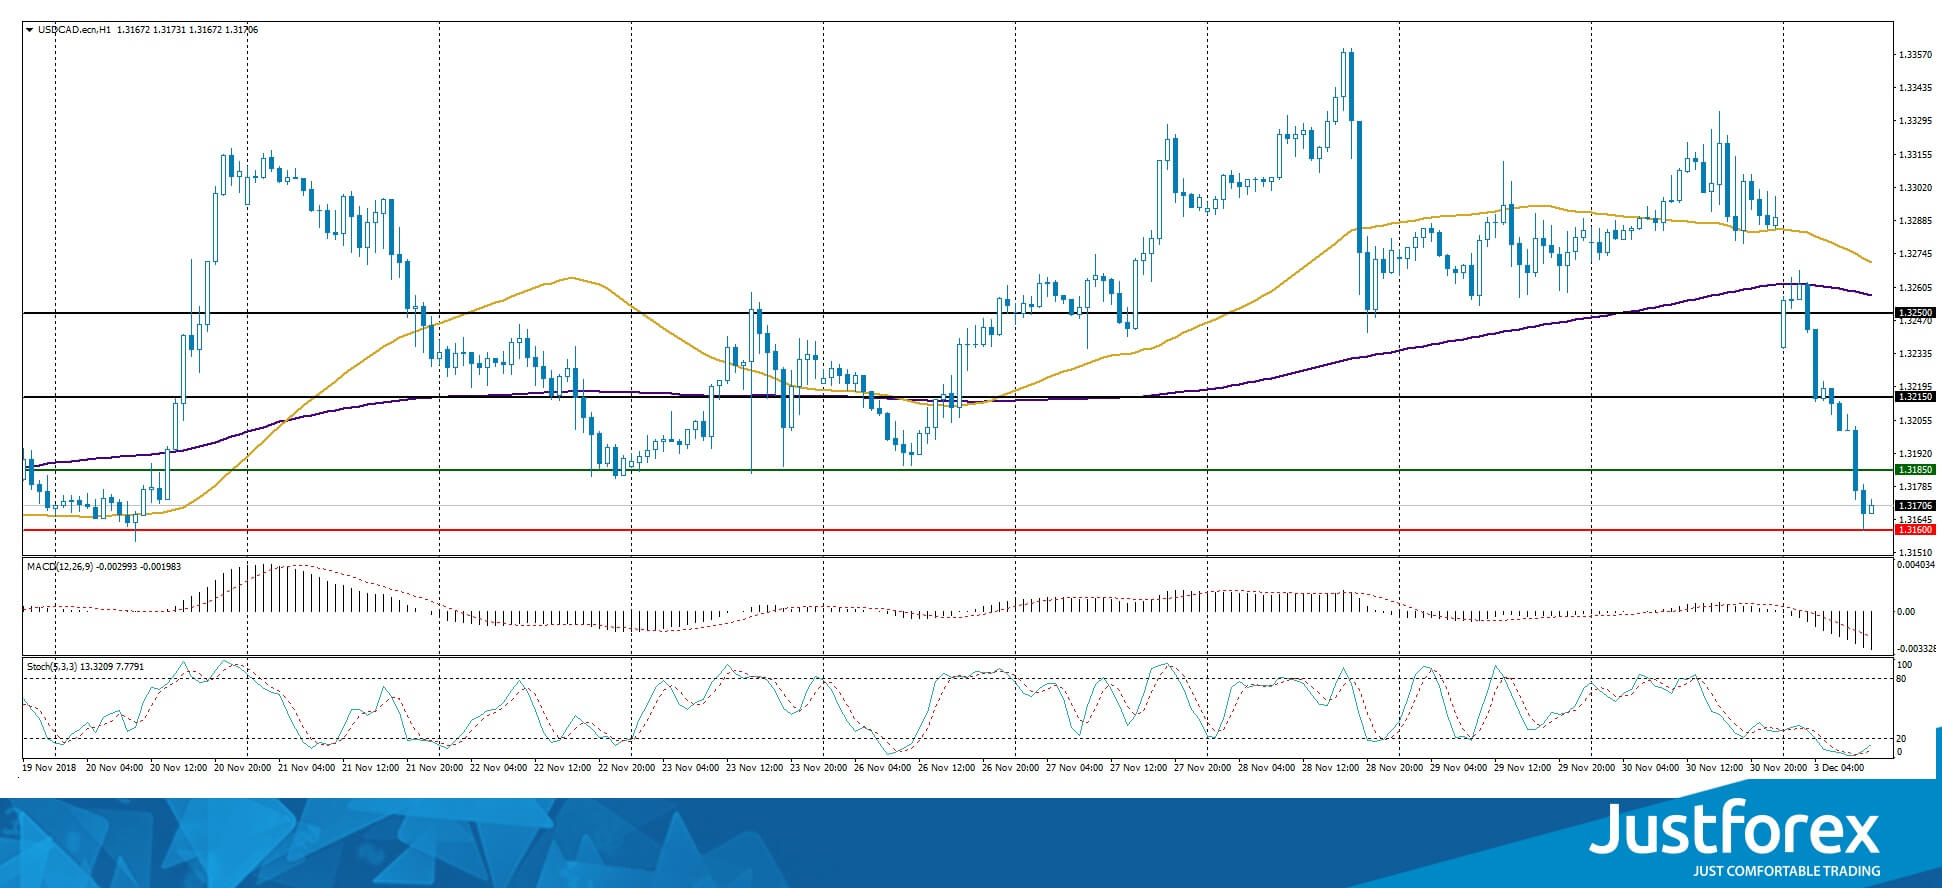
The price is being traded bellow 50 MA and 200 MA, which indicates the power of sellers.
The MACD histogram is in the negative zone and below the signal line, which gives a strong signal towards the sale of USD/CAD.
The Stochastic Oscillator is located in the oversold zone, the %K line has crossed the %D line. There are no signals at the moment.
Trading recommendations
Support levels: 1.31600, 1.31300, 1.31000
Resistance levels: 1.31850, 1.32150, 1.32500
If the price fixes below the support level of 1.31600, it is necessary to consider sales of USD/CAD. The movement is tending to 1.31300-1.31000.
Alternative option. If the price fixes above the 1.31850 mark, we recommend looking for entry points to the market to open long positions. The movement is tending to 1.32150-1.32400.
The USD/JPY currency pair
Technical indicators of the currency pair:
Prev Open: 113.479
Open: 113.654
% chg. over the last day: -0.01
Day’s range: 113.395 – 113.437
52 wk range: 104.56 – 114.74
The USD/JPY is showing a variety of trends. The quotes are consolidating. The local support and resistance levels are 113.300 and 113.500. Positions should be opened from these levels. The trading instrument has a tendency to fall. You should keep an eye on the 10-year US government bonds yield.
The news feed on the economy of Japan is calm.
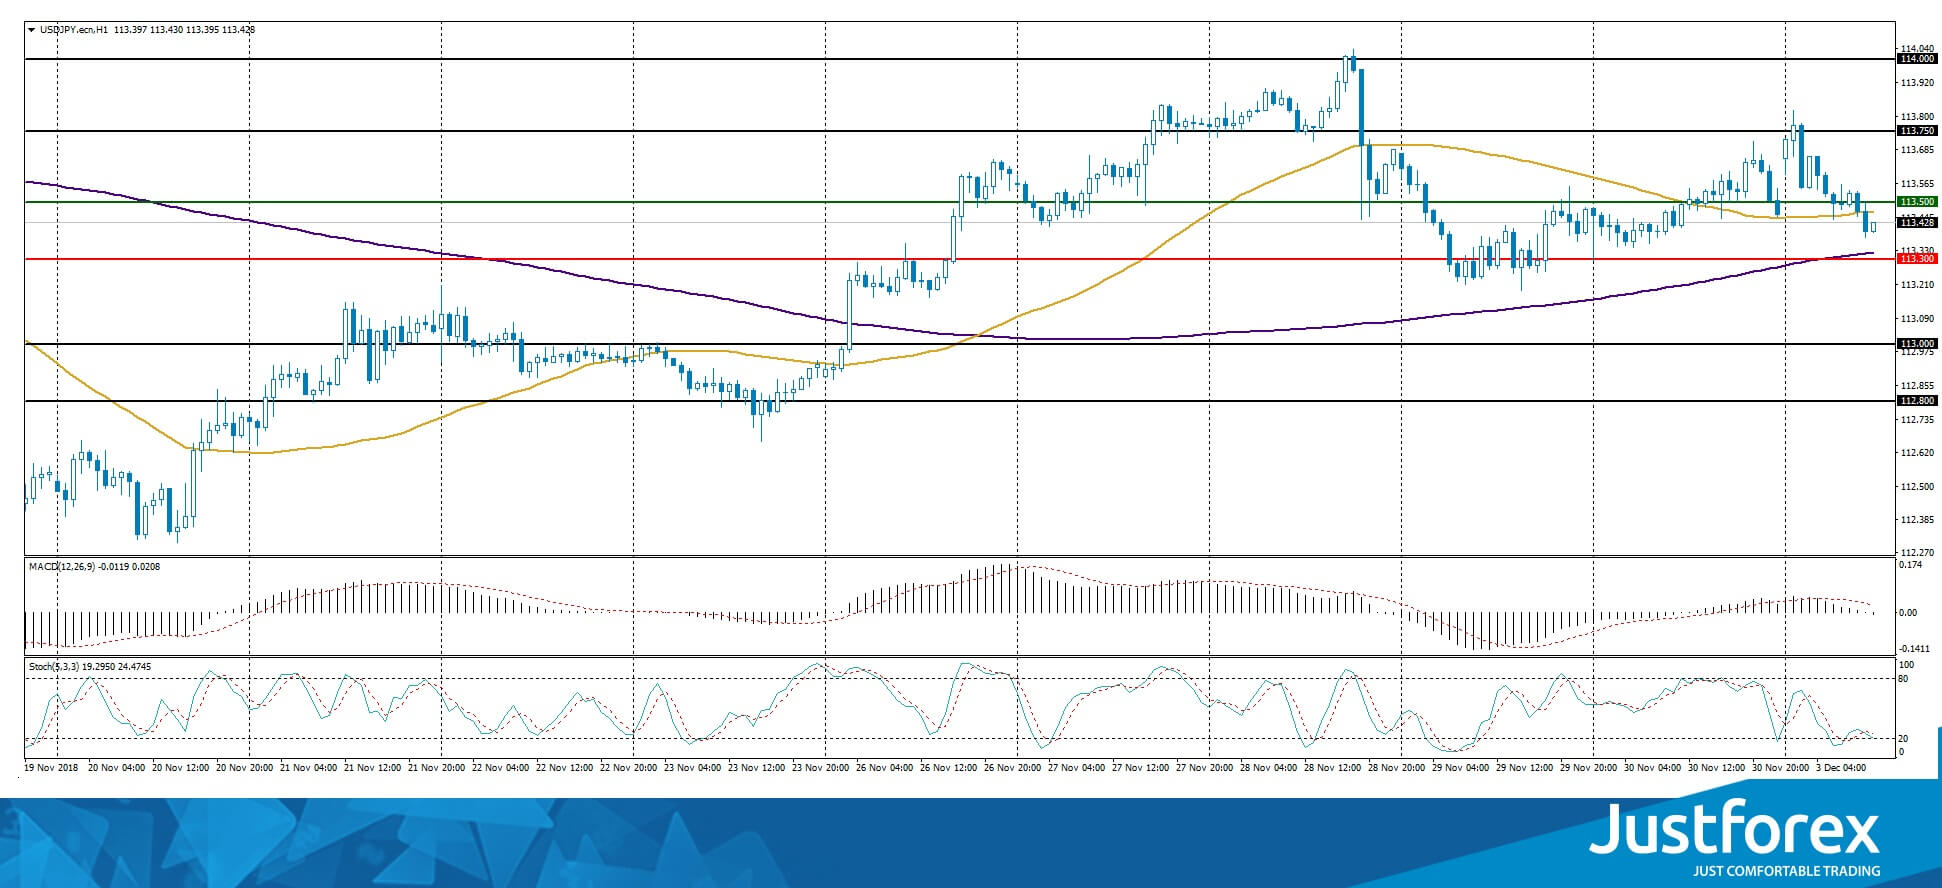
Indicators do not send accurate signals: the price has fixed between 50 MA and 200 MA.
The MACD histogram is near the 0 mark.
Stochastic Oscillator is near the oversold zone, the %K line has crossed the %D line. There are no accurate signals.
Trading recommendations
Support levels: 113.300, 113.000, 112.800
Resistance levels: 113.500, 113.750, 114.000
If the price fixes below the local support of 113.300,, the USD/JPY currency pair correction is expected. The movement is tending to 113.000-112.800.
An alternative may be the USD/JPY quotes growth to 113.750-114.000.


