
The EUR/USD currency pair
Technical indicators of the currency pair:
Prev Open: 1.13473
Open: 1.13687
% chg. over the last day: +0.28
Day’s range: 1.13604 – 1.13818
52 wk range: 1.1299 – 1.2557
The financial market participants are waiting for the labour market reports in the US for November. EUR/USD is consolidating. The local support and resistance levels are 1.13600 and 1.13850. Positions should be opened from these levels. You should also keep an eye on the US/China trading conflict.
The Economic News Feed for 07.12.2018:
GDP Report (EU) – 12:00 (GMT+2)
Labour Markets Report (US) – 15:30 (GMT+2)
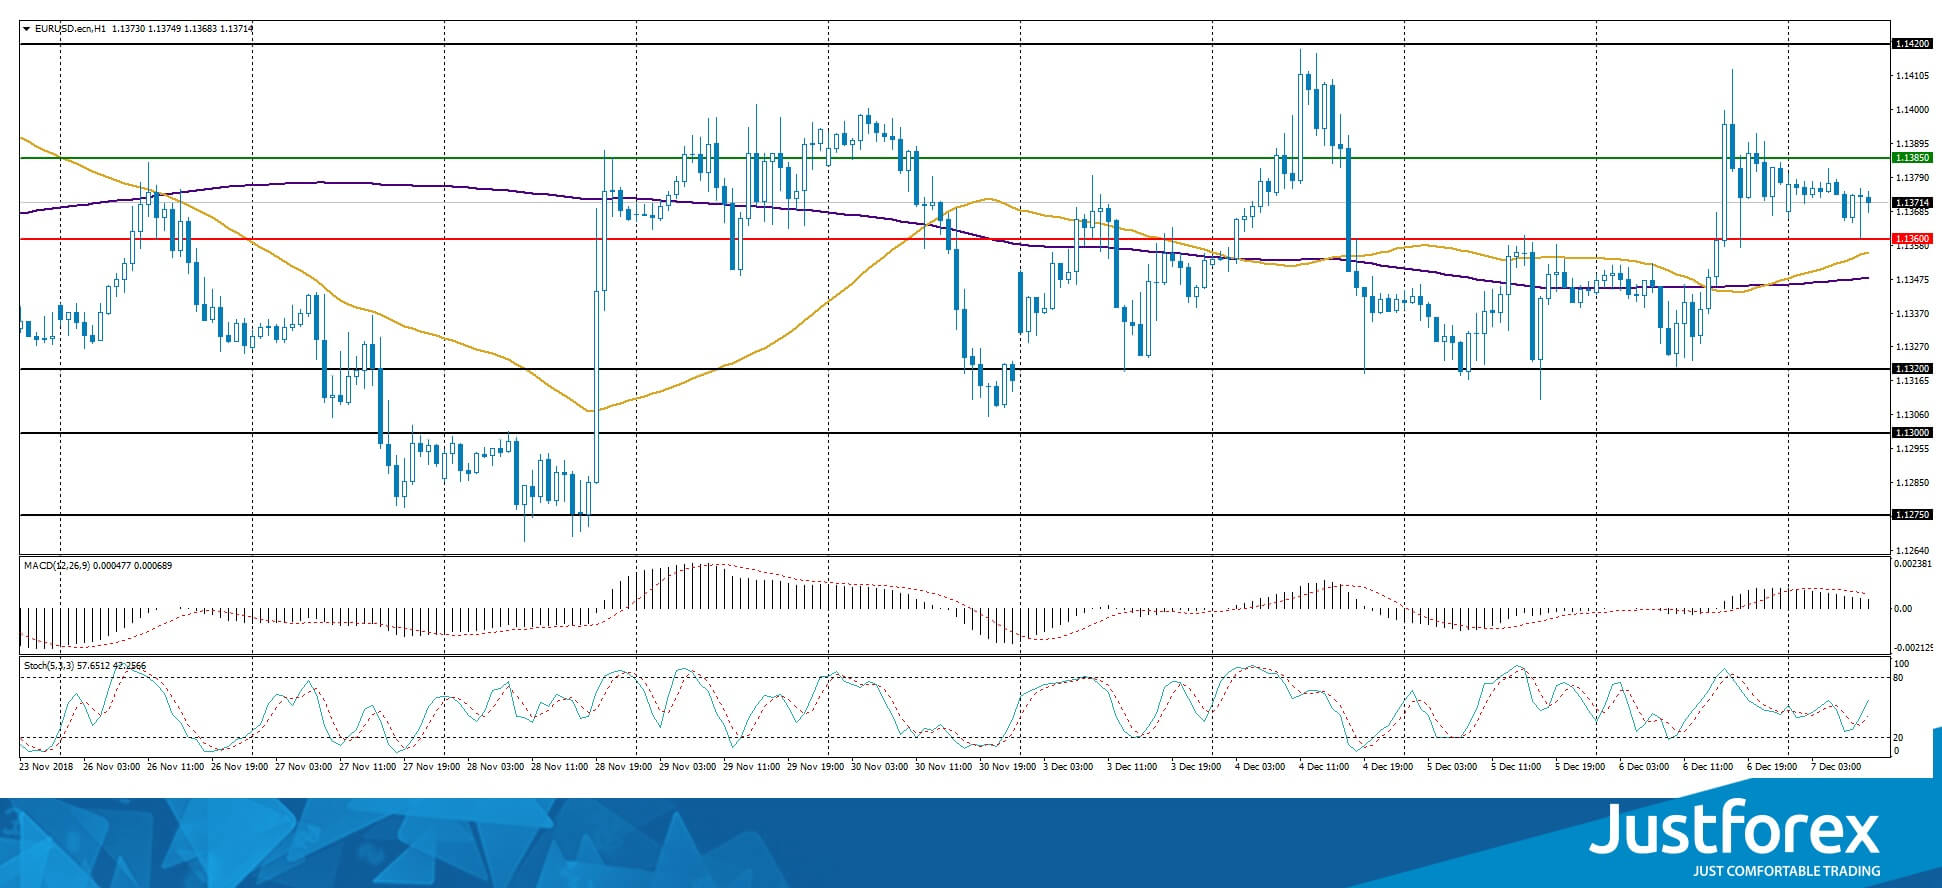
The price fixed above both 50 MA and 200 MA, which indicates the power of the buyers.
The MACD histogram is in the positive zone but below the signal line which gives a weak signal towards the purchase of EUR/USD.
Stochastic Oscillator is in the neutral zone, the %K line is above the %D line, which indicates a bullish sentiment.
Trading recommendations
Support levels: 1.13600, 1.13200, 1.13000
Resistance levels: 1.13850, 1.14200
If the price fixes below the support level of 1.13850, it is necessary to consider buying EUR/USD. The movement is tending to 1.14200-1.14500.
An alternative could be the descend of the EUR/USD quotes to the level of 1.13000.
The GBP/USD currency pair
Technical indicators of the currency pair:
Prev Open: 1.27321
Open: 1.27748
% chg. over the last day: +0.37
Day’s range: 1.27433 – 1.27863
52 wk range: 1.2662 – 1.4378
The GBP keeps trading in the long flat. There is no single trend. The financial market participants are waiting for more data regarding Brexit. Today all the attention will be focused on the reports from the US. The GBP/USD is trading between 1.27400-1.27800. You should open positions from these levels.
The Economic News Field for 07.12.2018 is calm.
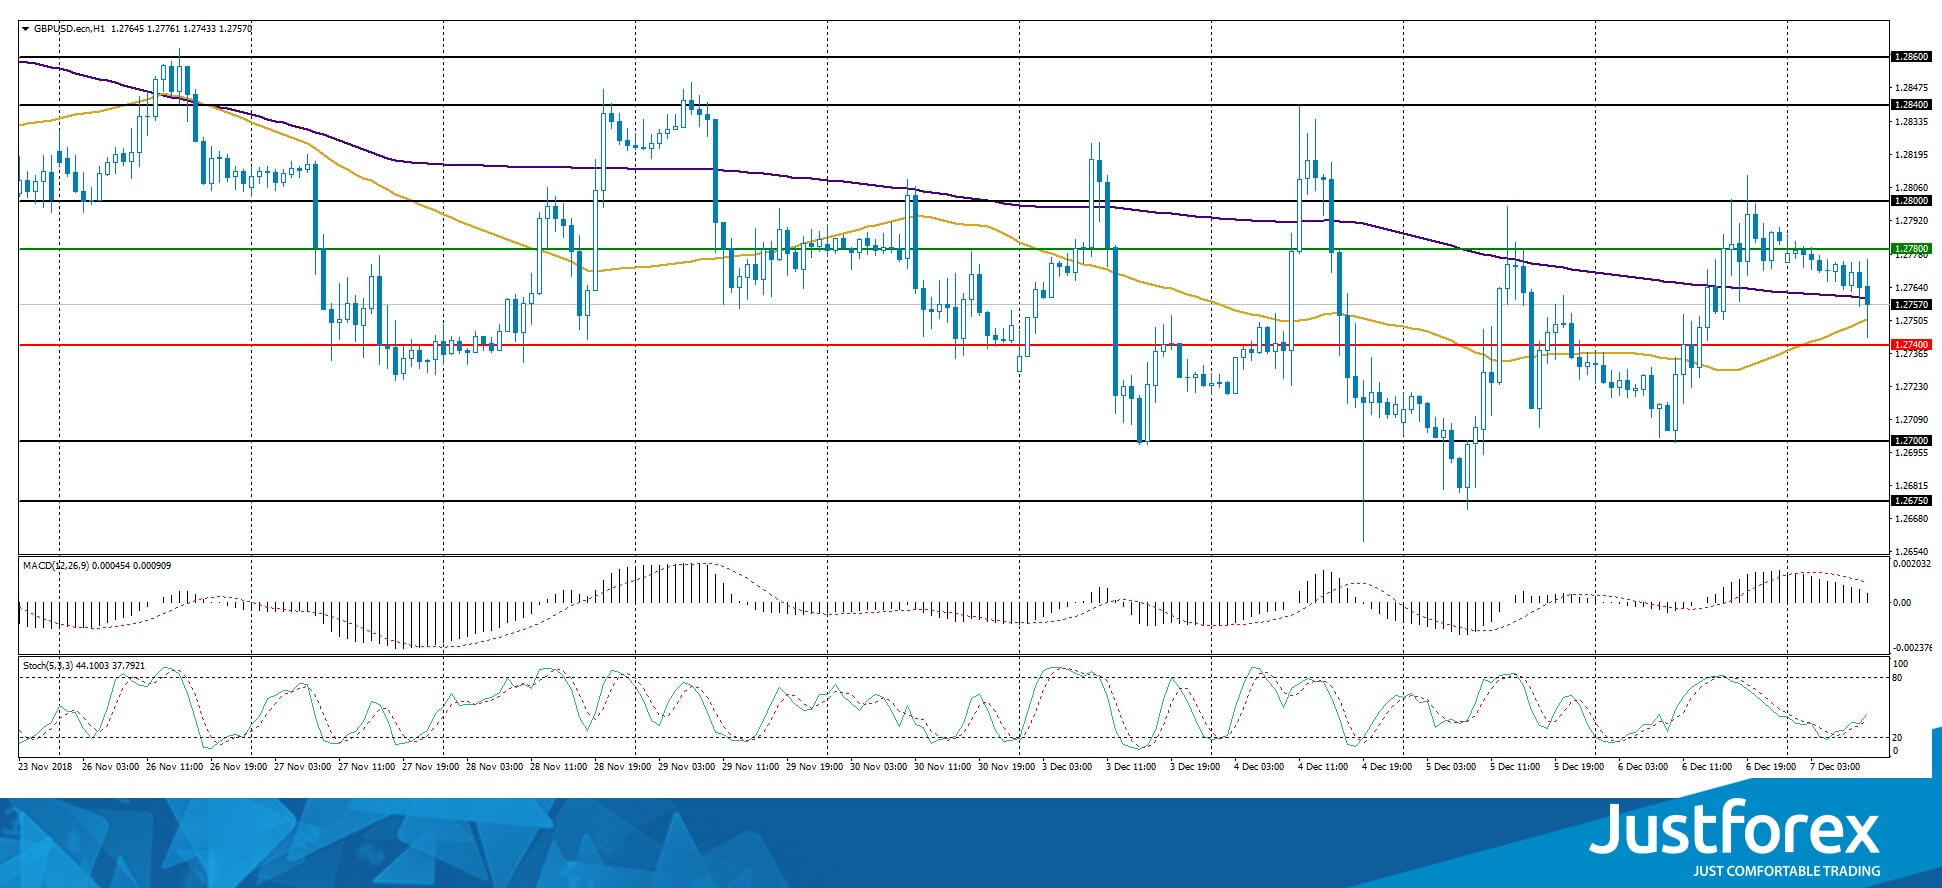
Indicator signals are ambiguous. The price has crossed both 50 MA and 200 MA.
The MACD histogram is in the positive zone, which indicates a weak bearish sentiment.
Stochastic Oscillator is in the neutral zone, the %K line is фищму the %D line, which points towards the growth of the GBP/USD.
Trading recommendations
Support levels: 1.27400, 1.27000, 1.26750
Resistance levels: 1.27800, 1.28000, 1.28400
If the price fixes below 1.27400, the GBP/USD quotes are expected to fall. The movement is tending to 1.27000-1.26750.
An alternative could be a growth in the GBP/USD currency pair to 1.28250-1.28500.
The USD/CAD currency pair
Technical indicators of the currency pair:
Prev Open: 1.33528
Open: 1.33772
% chg. over the last day: +0.28
Day’s range: 1.33760 – 1.33985
52 wk range: 1.2248 – 1.3387
The USD/CAD is consolidating after sudden growth. A correction is highly probable soon. The key support and resistance levels are 1.33600 and 1.34000. Positions should be opened from these levels. Investors are waiting for the labour market reports from the US and Canada. You should also keep an eye on the oil quotes dynamics.
At 15:30 (GMT+2:00), Canada will publish the labour market reports.
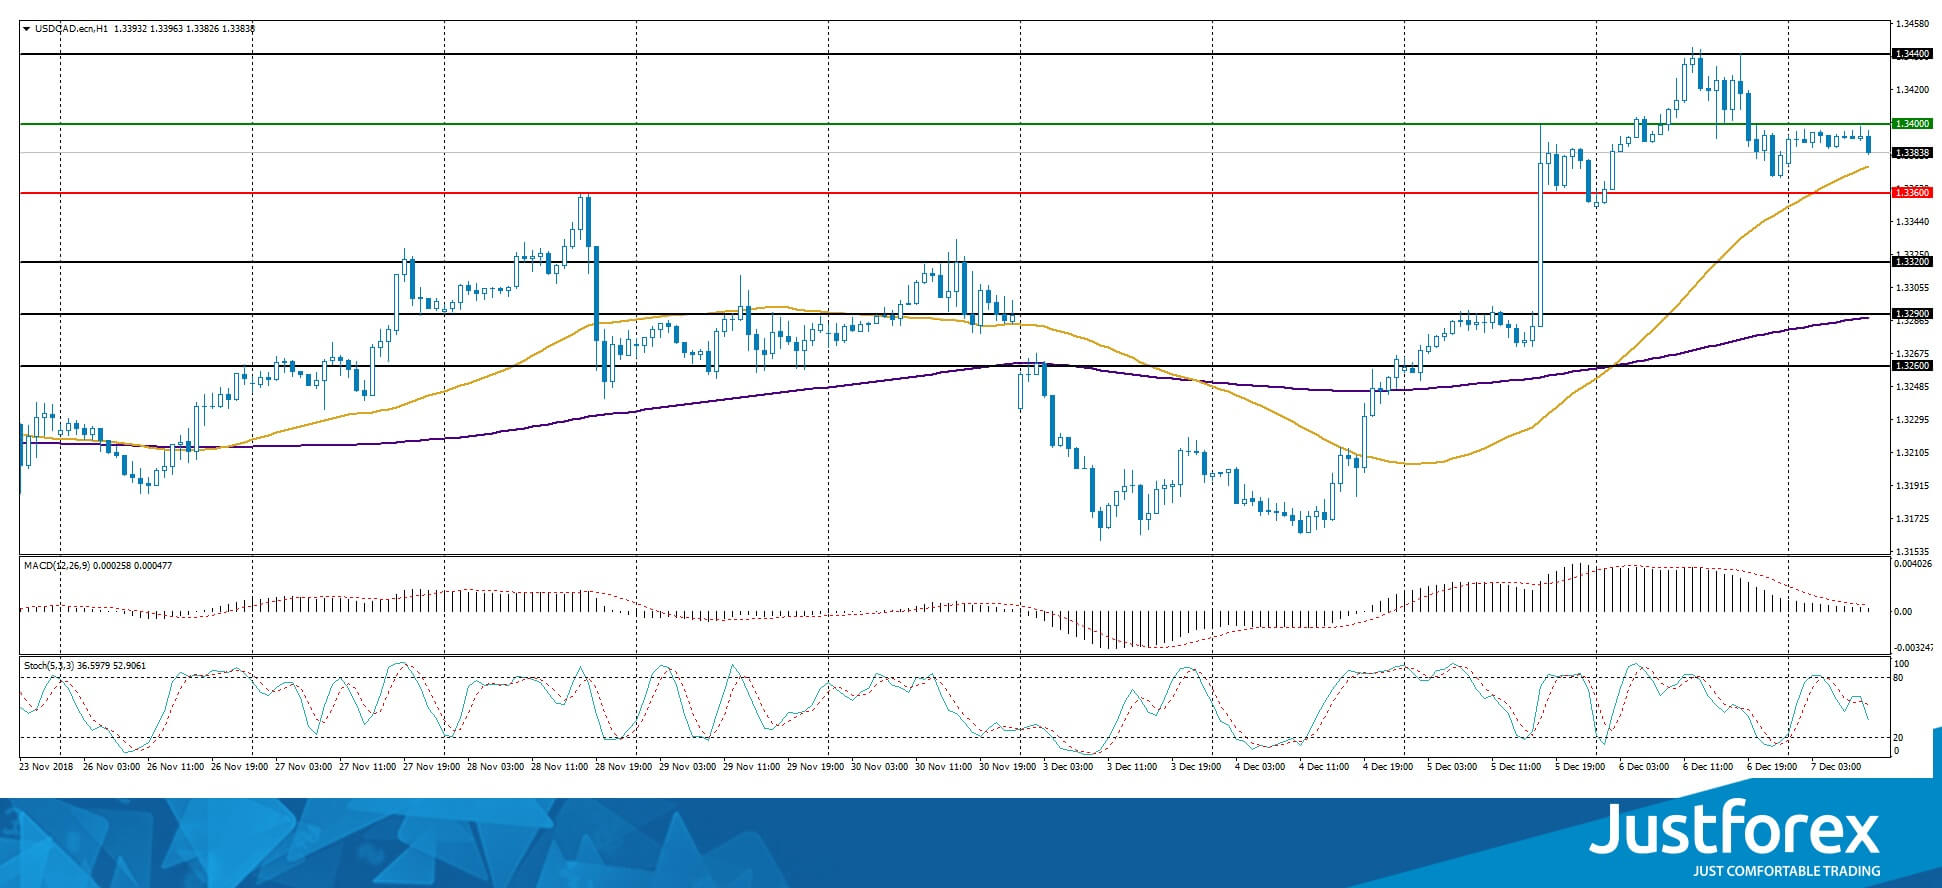
The price has fixed above 50 MA and 200 MA, which indicates the power of buyers.
The MACD histogram is close to 0.
The Stochastic Oscillator is in the neutral zone, the %K line is below the %D line, which indicates a drop in the USD/CAD quotes.
Trading recommendations
Support levels: 1.33600, 1.33200, 1.32900
Resistance levels: 1.34000, 1.34400
If the price fixes above the local resistance of 1.34000, further growth of the USD/CAD quotes is expected. The movement is tending to 1.34400-1.34750.
Alternative option. If the price fixes below 1.33600, we recommend looking for market entry points to open short positions. The movement is tending to 1.33200-1.33000.
The USD/JPY currency pair
Technical indicators of the currency pair:
Prev Open: 113.183
Open: 112.649
% chg. over the last day: -0.42
Day’s range: 112.602 – 112.927
52 wk range: 104.56 – 114.74
The USD/JPY is still showing a variety of trends. The technical picture is ambigous. The labour market report from the US is in the spotlight The local support and resistance levels are 112.600 and 112.900. Positions should be opened from these levels. You should keep an eye on the yield of the US Treasury bonds.
The news feed on the Japanese economy is calm.
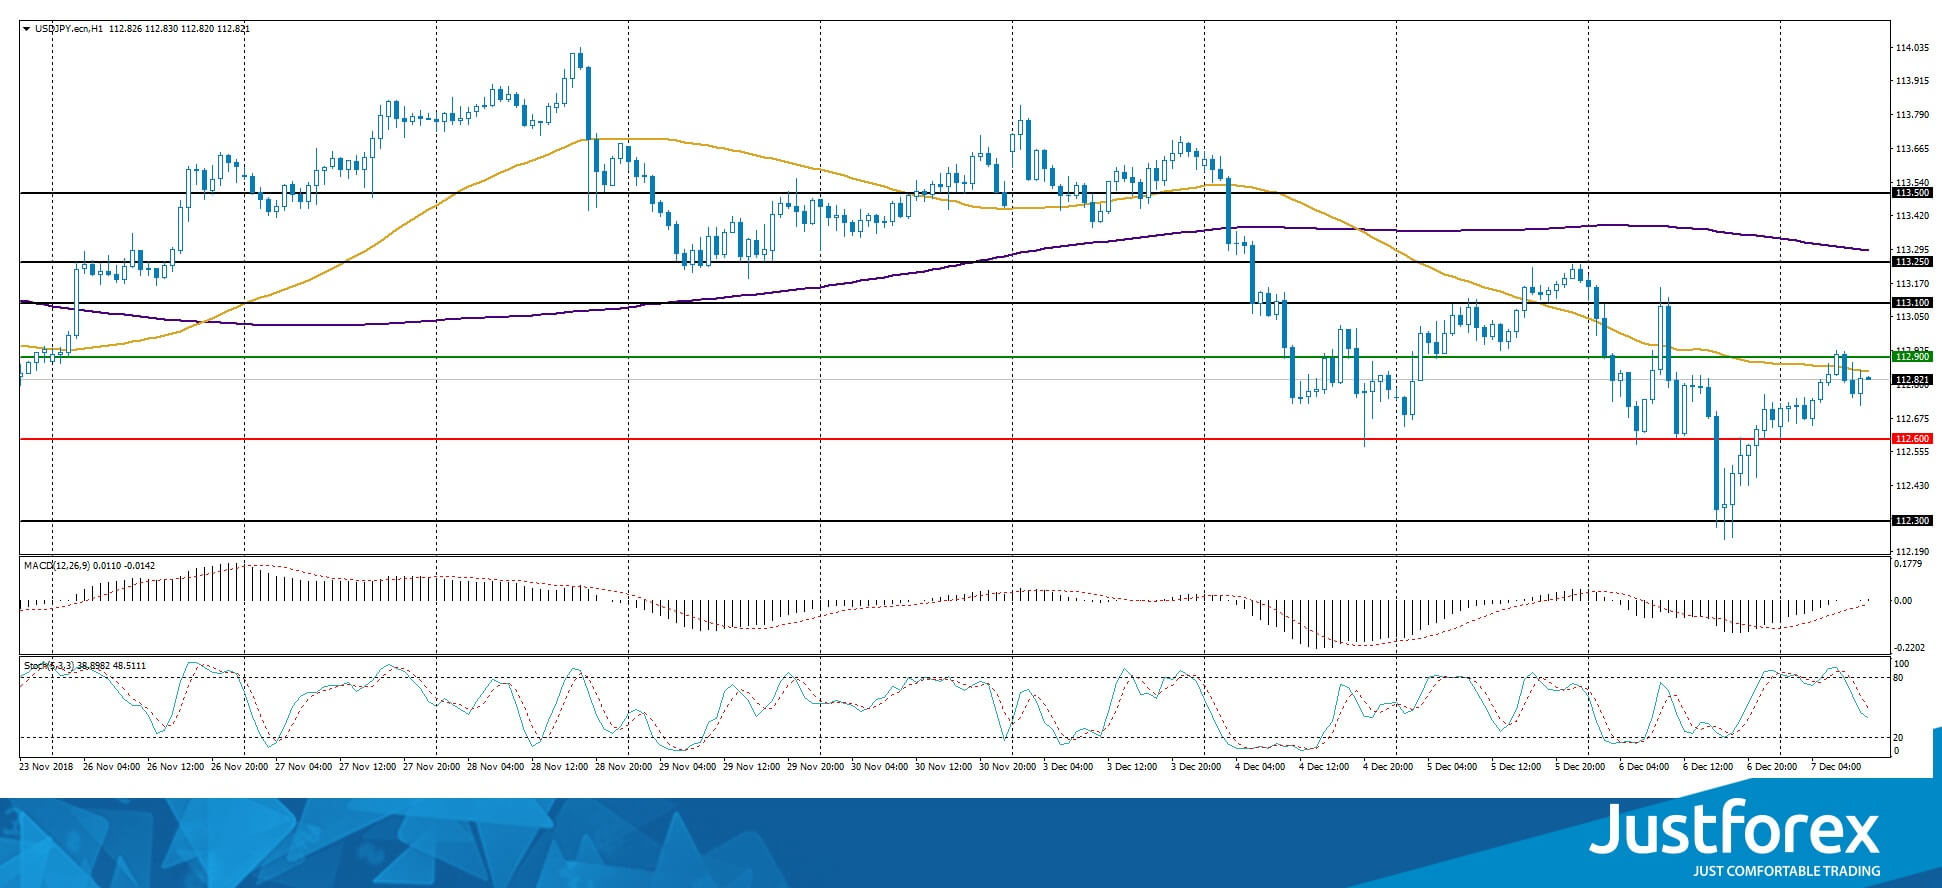
Indicators do not provide precise data, the price is testing the 50 MA which is a strong dynamic resistance.
The MACD histogram is close to 0.
The Stochastic Oscillator is in the neutral zone, the %K line is below the %D line which indicates the decline of the USD/JPY quotes.
Trading recommendations
Support levels: 112.600, 112.300
Resistance levels: 112.900, 113.100, 113.250
If the price fixes below the support level of 112.600, it is necessary to consider selling USD/JPY. The movement is tending to 112.000.
An alternative could be the growth of the USD/JPY quotes to 113.250-113.500.


