
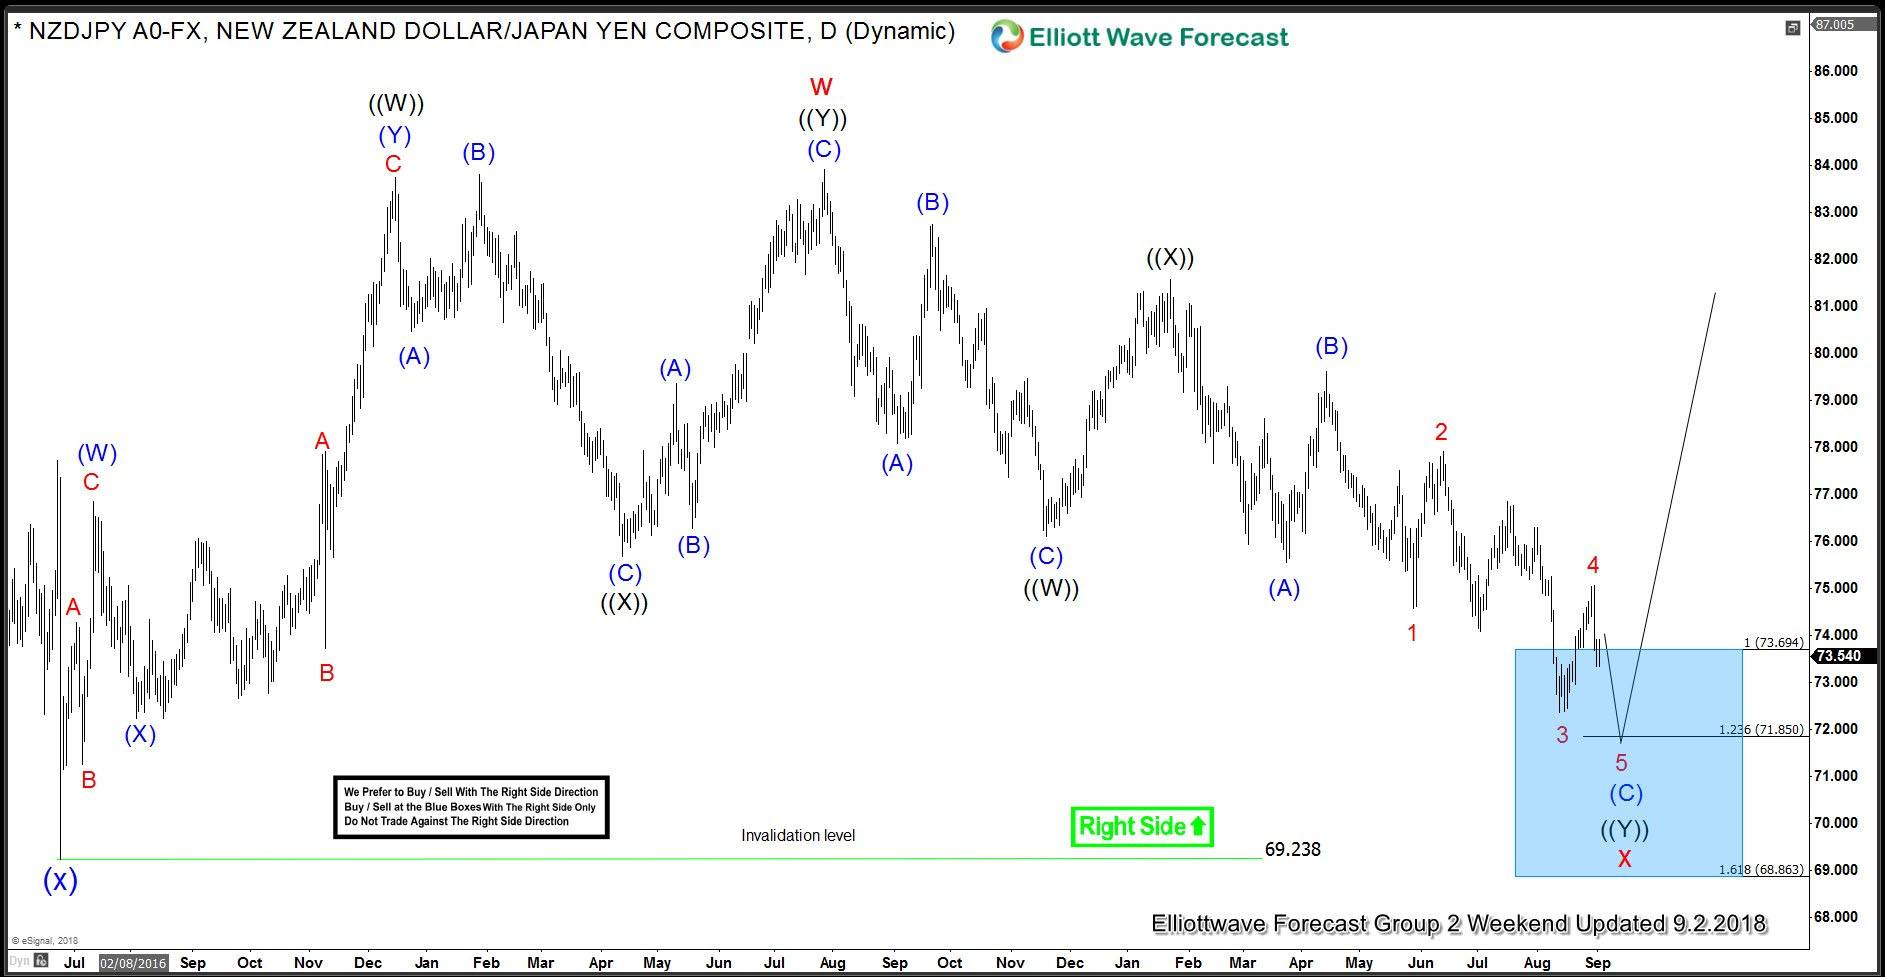
NZDJPY has put in a strong rally over the past couple of months gain 9.14% from a low of 72.25 to a high of 78.86. Earlier this year, we advised clients and followers that pair was reaching an inflection area between 73.70 – 68.86 and pair should find a low in this area and start turning higher. Below, we take a look at daily chart presented to members on 2 September 2018.
NZDJPY 2 September Daily Chart
Later in September 2018, pair reached the inflection area between 73.70 – 68.86 but based on Elliott wave structure and market correlation, we called another low to complete a double three Elliott wave structure down from 7/27/2017 (83.91) peak. After another low, we expected the pair to turn higher and resume the rally for a new high above 83.91 peak or a bounce back toward 50- 61.8 Fibonacci retracement of the decline from 83.91 peak.
In the chart below, we can see that pair made a marginal new low on 9/10/2018 (72.25) and turned up strongly, first leg up ended at 75.54 and we have labelled that as blue wave (1), this was followed by a deep test of 72.25 low to complete blue wave (2) at 72.32, then pair started rallying again and reached a high of 78.86 which is 200% Fibonacci extension of blue wave (1) related to wave (2) and hence could have completed wave (3). As pair has exceeded 161.8 Fibonacci extension of wave (1)-(2) so we are expecting the next pull back to be a blue wave (4) and if the wave count is correct, it should be followed by another high to complete blue wave (5) of black wave ((1)). Afterward, expect a larger wave ((2)) pull back to correct the cycle from 72.25 low and rally to continue. Alternatively, wave rally from 6/24/2018 low could take the form of a double three “wxy” structure rather than “abc” which would mean wave ((1)) could become wave ((A)) and wave ((2)) could be wave ((B)).
NZDJPY Daily Elliott Wave Analysis
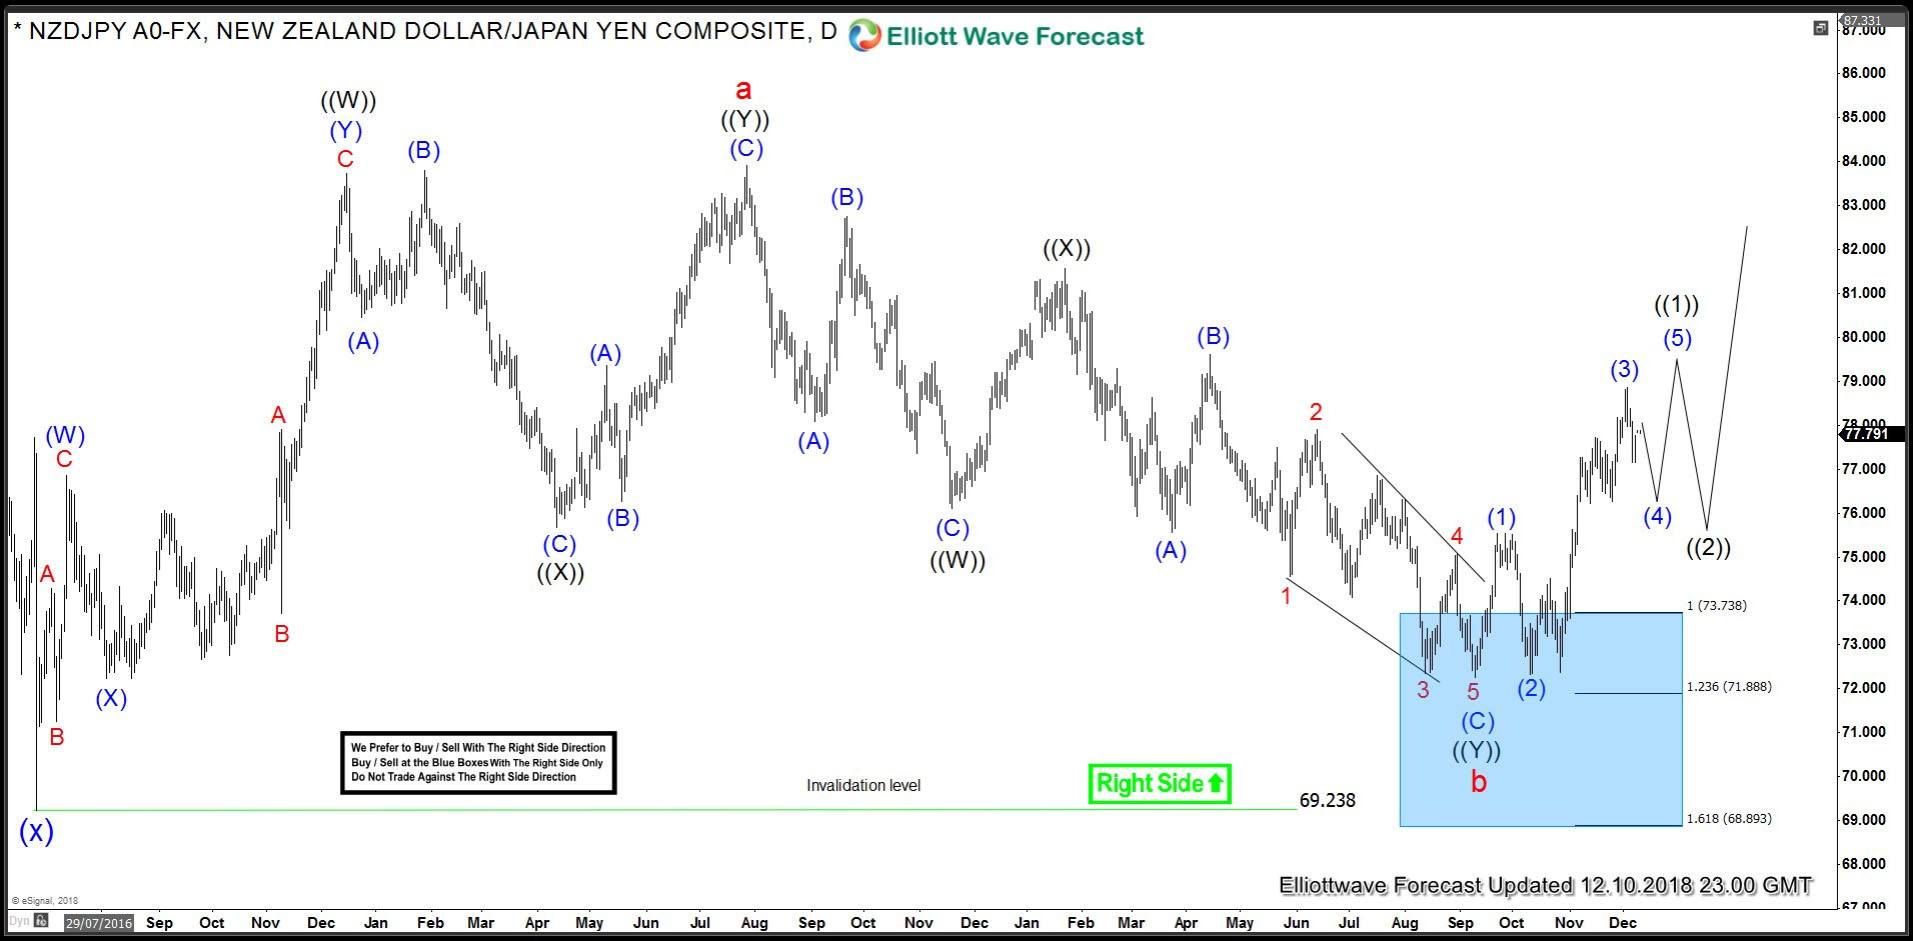
We don’t like selling the pair and we expect buyers to appear in the pull backs in wave (4) and later on in wave ((2)). In order to see the details analysis in the short-term and see the areas where wave (4) can end, possible target for wave (5) and how to define the buying area once wave ((2)) pull back starts, join us and learn to use Elliott Wave Theory in a more practical way.


